Free Access
Fig. 10
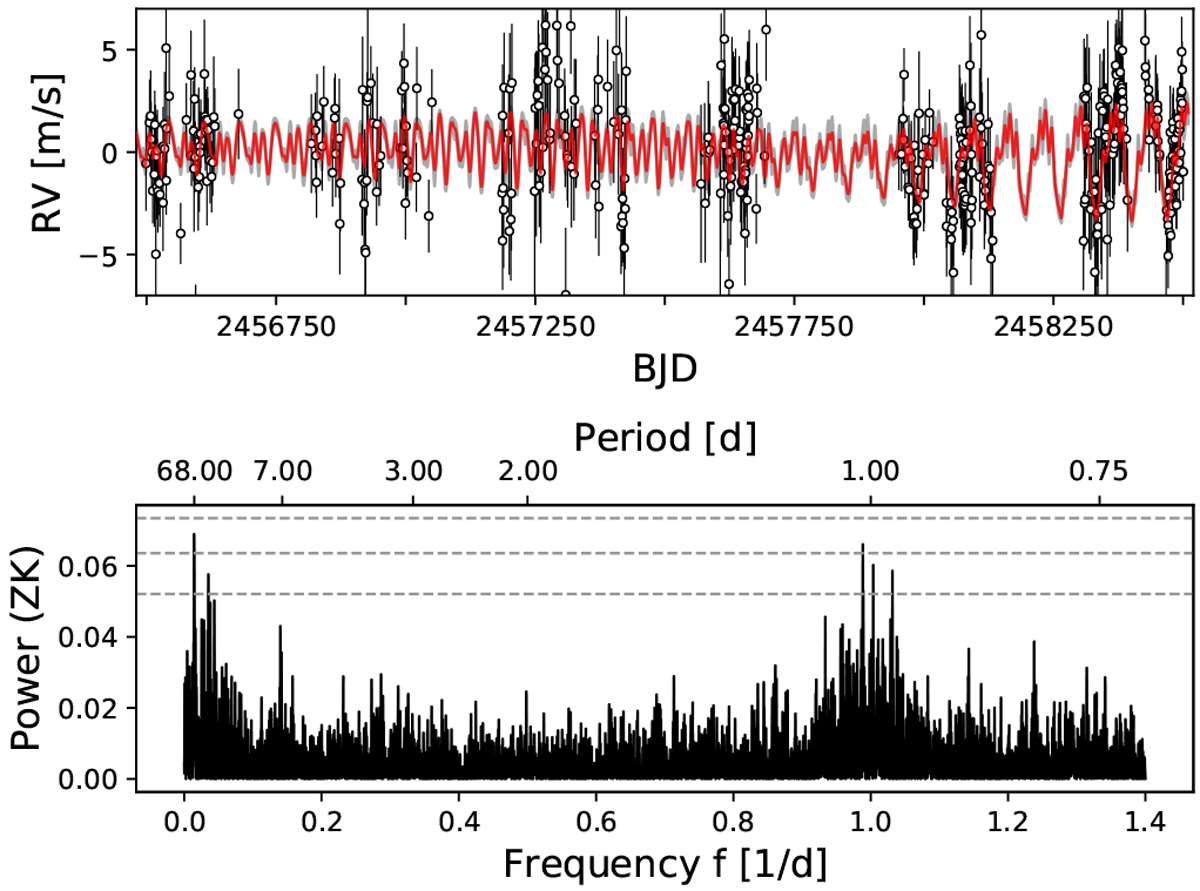
Median GP model and its GLS periodogram based on the stable posterior samples for YZ Ceti. In this plot the three-planet model is not included, and is subtracted from the RV data. We show only the densely sampled region between BJD 2 456 480 and BJD 2 458 520. The gray area indicates the interdecile range of the GP model.
Current usage metrics show cumulative count of Article Views (full-text article views including HTML views, PDF and ePub downloads, according to the available data) and Abstracts Views on Vision4Press platform.
Data correspond to usage on the plateform after 2015. The current usage metrics is available 48-96 hours after online publication and is updated daily on week days.
Initial download of the metrics may take a while.