Fig. A.1.
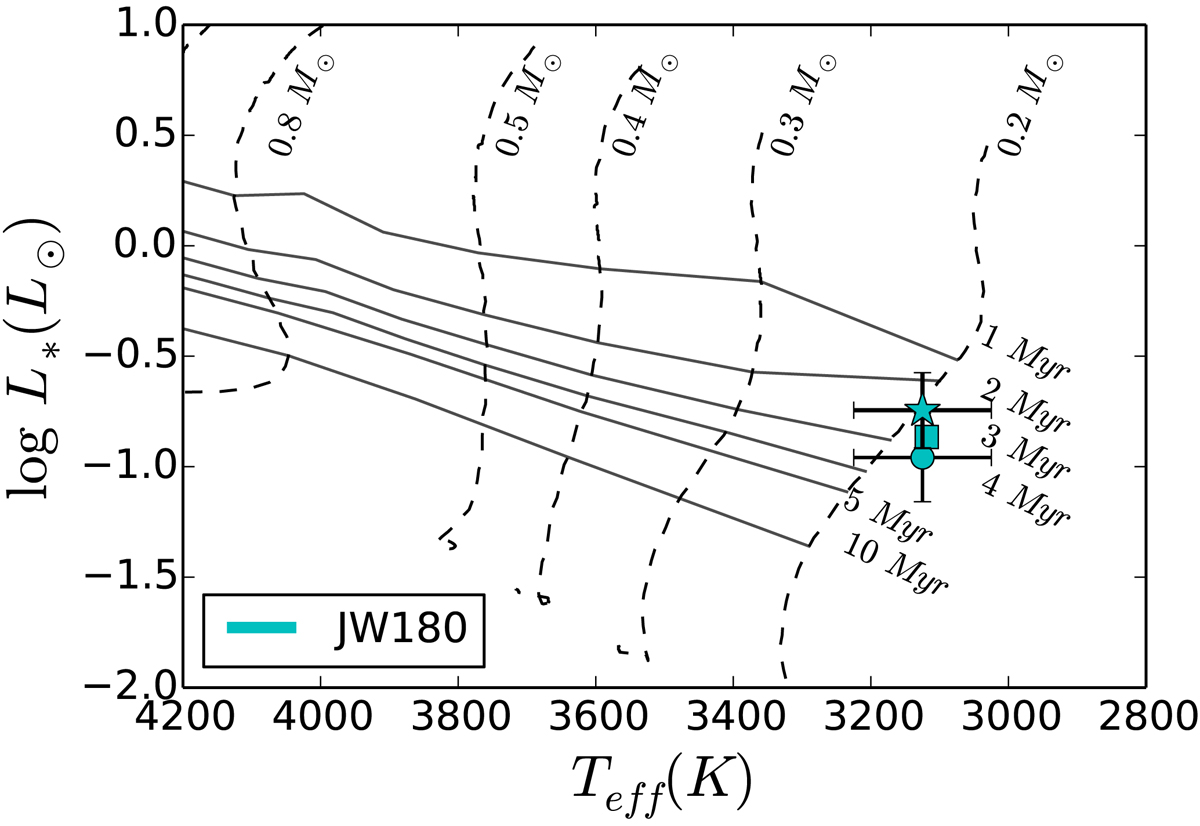
Hertzsprung-Russel diagram with Siess et al. (2000) evolutionary tracks from 0.2 to 0.8 M⊙ (dashed lines). Isochrones corresponding to 1, 2, 3, 4, 5, and 10 Myr (solid lines) are also represented. The circle corresponds to the value determined in this work and the square to the value of Hillenbrand (1997), rescaled to the distance derived from the Gaia DR2 parallax. The cyan star represents the value for JW180 assuming a distance of 414 ± 7 pc.
Current usage metrics show cumulative count of Article Views (full-text article views including HTML views, PDF and ePub downloads, according to the available data) and Abstracts Views on Vision4Press platform.
Data correspond to usage on the plateform after 2015. The current usage metrics is available 48-96 hours after online publication and is updated daily on week days.
Initial download of the metrics may take a while.