Fig. 6.
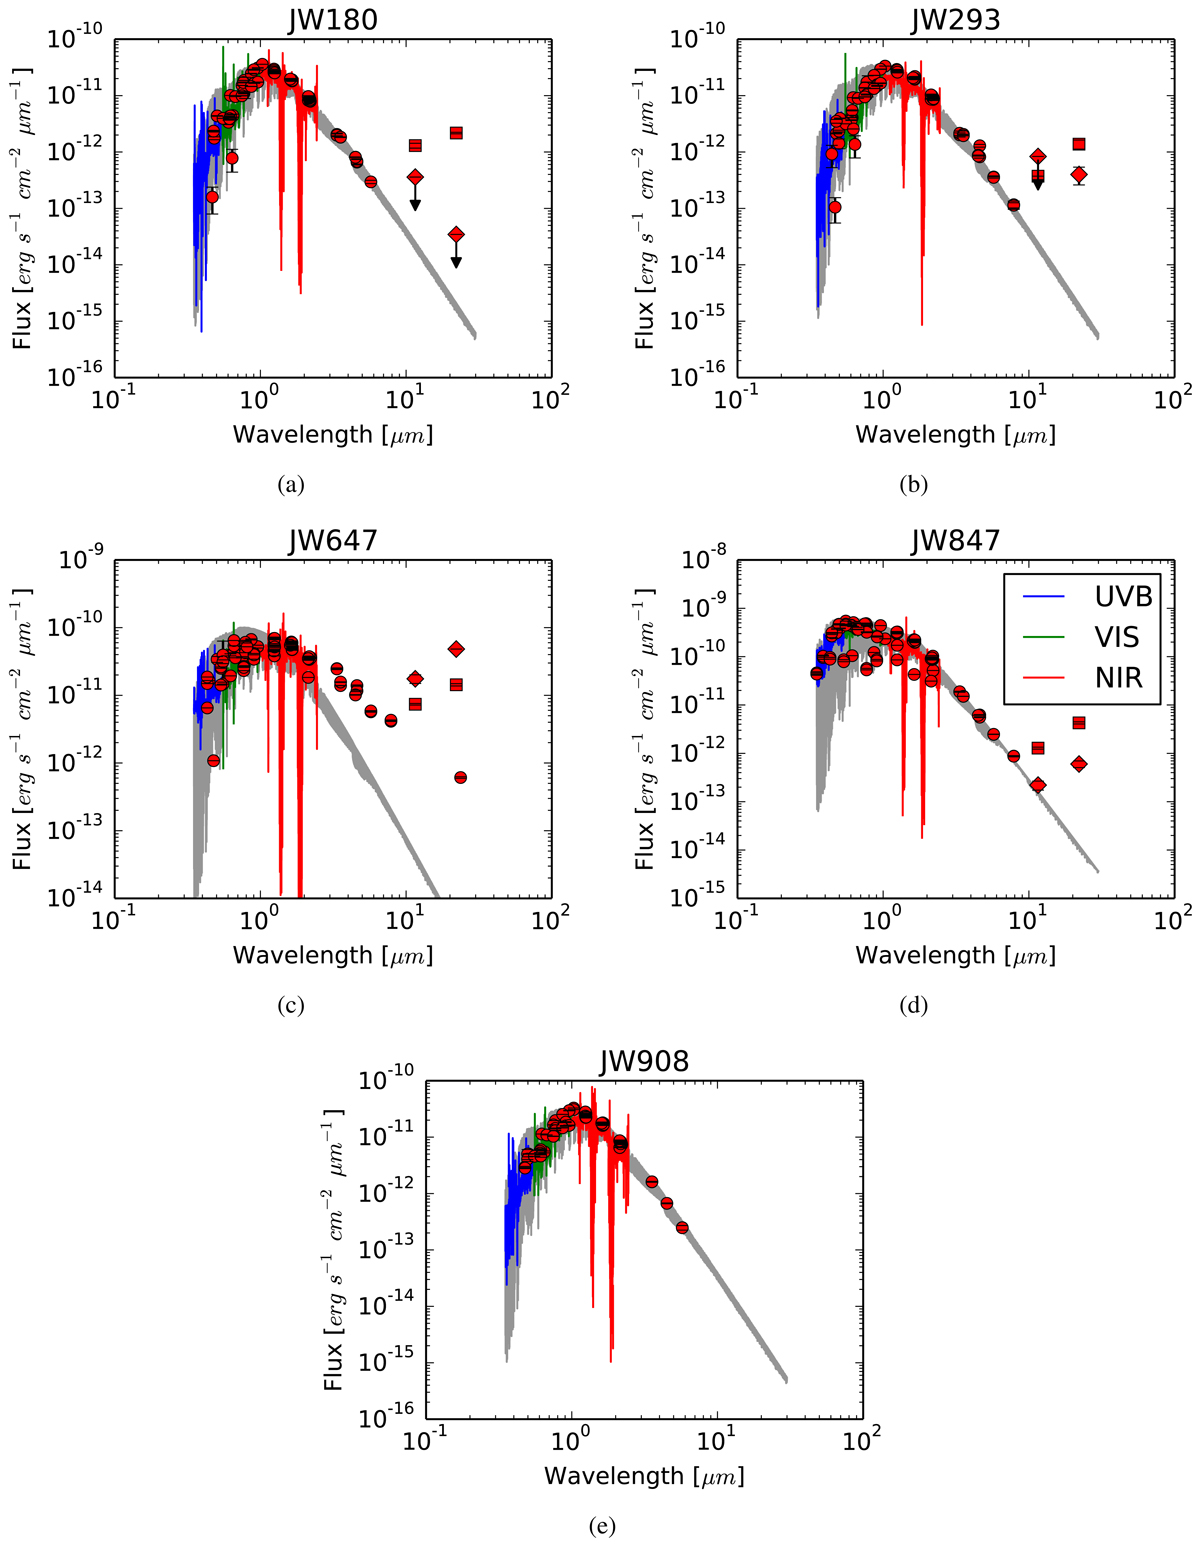
Spectral energy distributions of targets. The spectra of the stars are shown for different wavebands: ultra-violet (blue), visible (green), and infrared (red). The gray line corresponds to the BT-Settl synthetic spectra from Allard et al. (2012) with effective temperatures of 3100, 3200, 3700, 4200, and 3200 K (for plots a, b, c, d, and e, respectively), log g = 4.0, solar metallicity and zero chemical index. The red dots correspond to the available photometry at Vizier (Ochsenbein et al. 2000) for a search radius of 0.5″. The squares and diamonds correspond to WISE (Cutri et al. 2012) and AllWISE (Cutri et al. 2013) photometry, respectively, for the W3 and W4 bands. The black arrows represent upper limits for the photometric values shown.
Current usage metrics show cumulative count of Article Views (full-text article views including HTML views, PDF and ePub downloads, according to the available data) and Abstracts Views on Vision4Press platform.
Data correspond to usage on the plateform after 2015. The current usage metrics is available 48-96 hours after online publication and is updated daily on week days.
Initial download of the metrics may take a while.