Fig. 3.
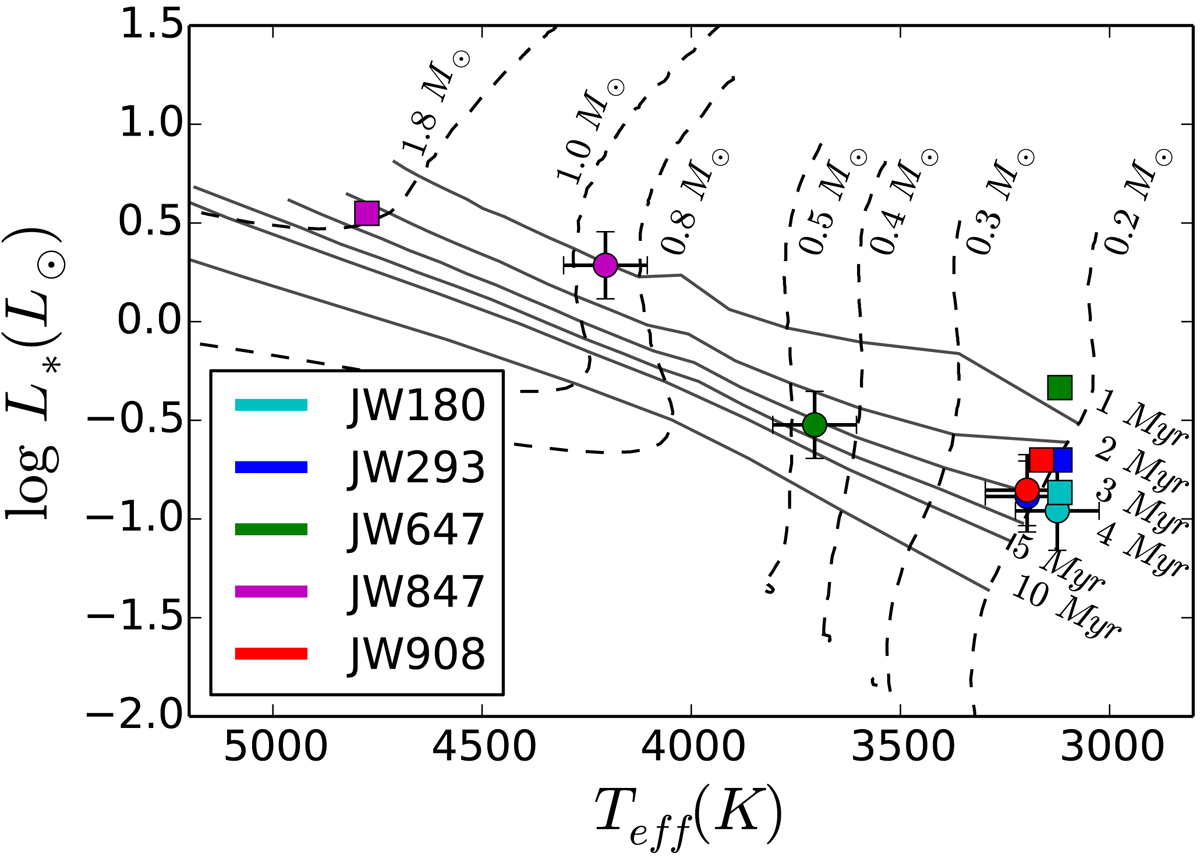
Hertzsprung-Russel diagram with Siess et al. (2000) evolutionary tracks from 0.2 to 1.8 M⊙ (dashed lines). Isochrones corresponding to 1, 2, 3, 4, 5, and 10 Myr (solid lines) are also represented. The circles correspond to the values determined in this work and the squares to the values of Hillenbrand (1997), rescaled to the distances derived from the Gaia DR2 parallaxes.
Current usage metrics show cumulative count of Article Views (full-text article views including HTML views, PDF and ePub downloads, according to the available data) and Abstracts Views on Vision4Press platform.
Data correspond to usage on the plateform after 2015. The current usage metrics is available 48-96 hours after online publication and is updated daily on week days.
Initial download of the metrics may take a while.