Fig. 3.
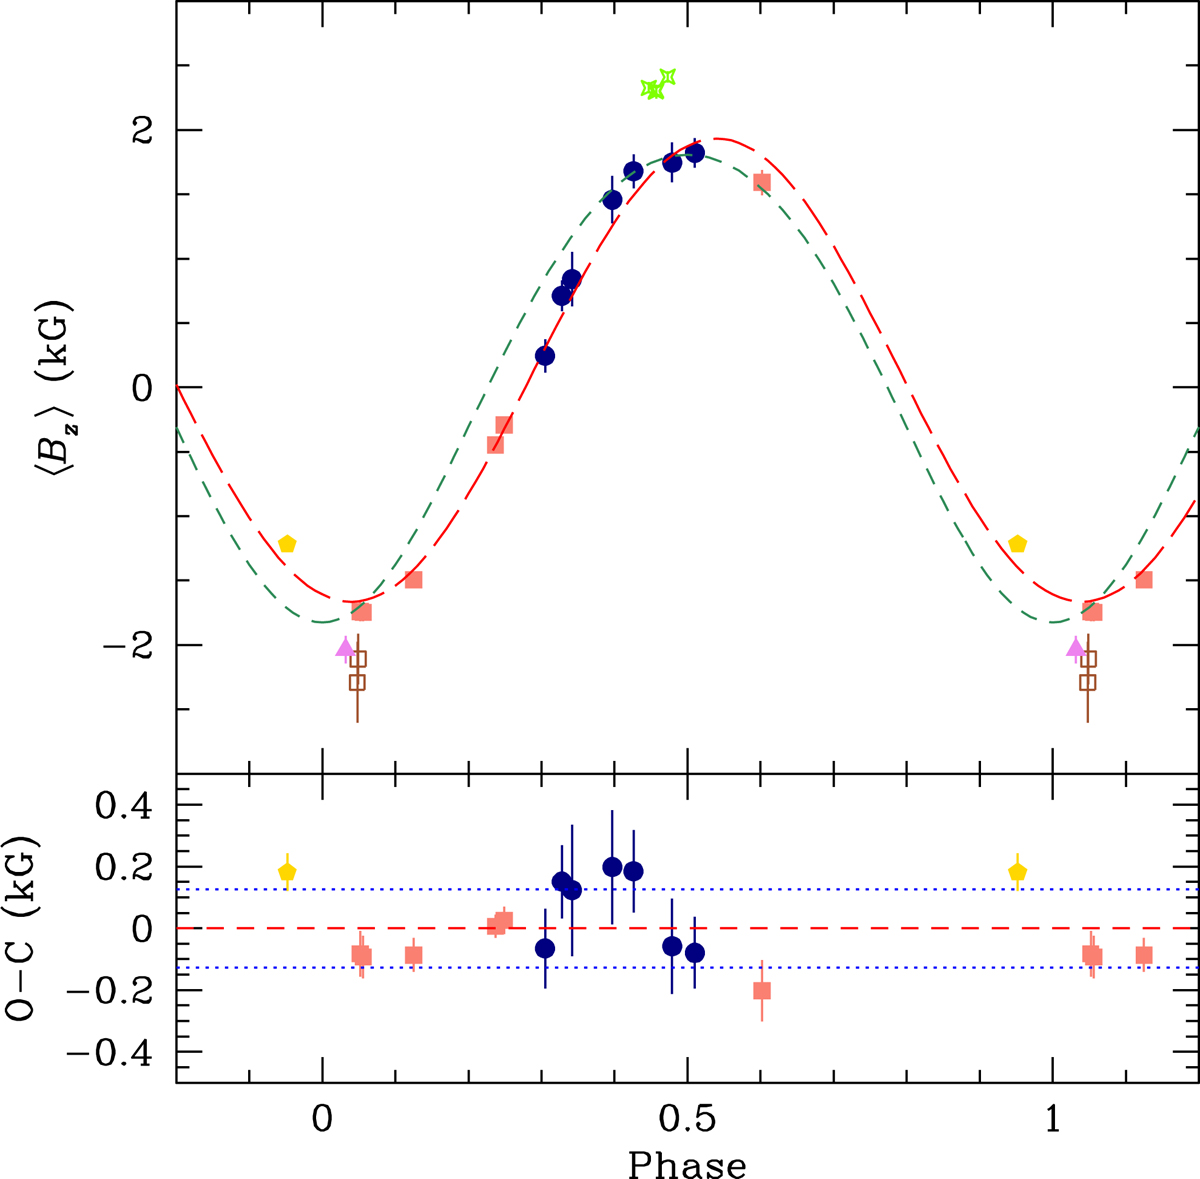
Upper panel: mean longitudinal magnetic field of HD 166473 against rotation phase. The different symbols identify the sources of the ⟨Bz⟩ values, as follows: open squares (brown) or filled triangle (violet): Mathys & Hubrig (1997, CASPEC); filled circles (dark blue): Mathys (2017, CASPEC); four pointed open stars (light green): Bagnulo et al. (2015, FORS-1); filled pentagon (yellow): this paper (HARPSpol); filled squares (salmon): this paper (ESPaDOnS). The long-dashed line (red) is the best fit of the CASPEC measurements of Mathys (2017) and of the HARPSpol and ESPaDOnS data by a cosine wave (see Eq. (5)). The short-dashed line (green) corresponds to the superposition of low-order multipoles discussed in Sect. 4. Lower panel: differences O–C between the individual ⟨Bz⟩ measurements and the best-fit curve, against rotation phase. The dotted lines (blue) correspond to ±1 rms deviation of the observational data about the fit (red dashed line). The symbols are the same as in the upper panel. The CASPEC measurements of Mathys & Hubrig (1997) and the FORS-1 measurements are not shown in this panel as they were not included in the fit (see text).
Current usage metrics show cumulative count of Article Views (full-text article views including HTML views, PDF and ePub downloads, according to the available data) and Abstracts Views on Vision4Press platform.
Data correspond to usage on the plateform after 2015. The current usage metrics is available 48-96 hours after online publication and is updated daily on week days.
Initial download of the metrics may take a while.