Fig. 2.
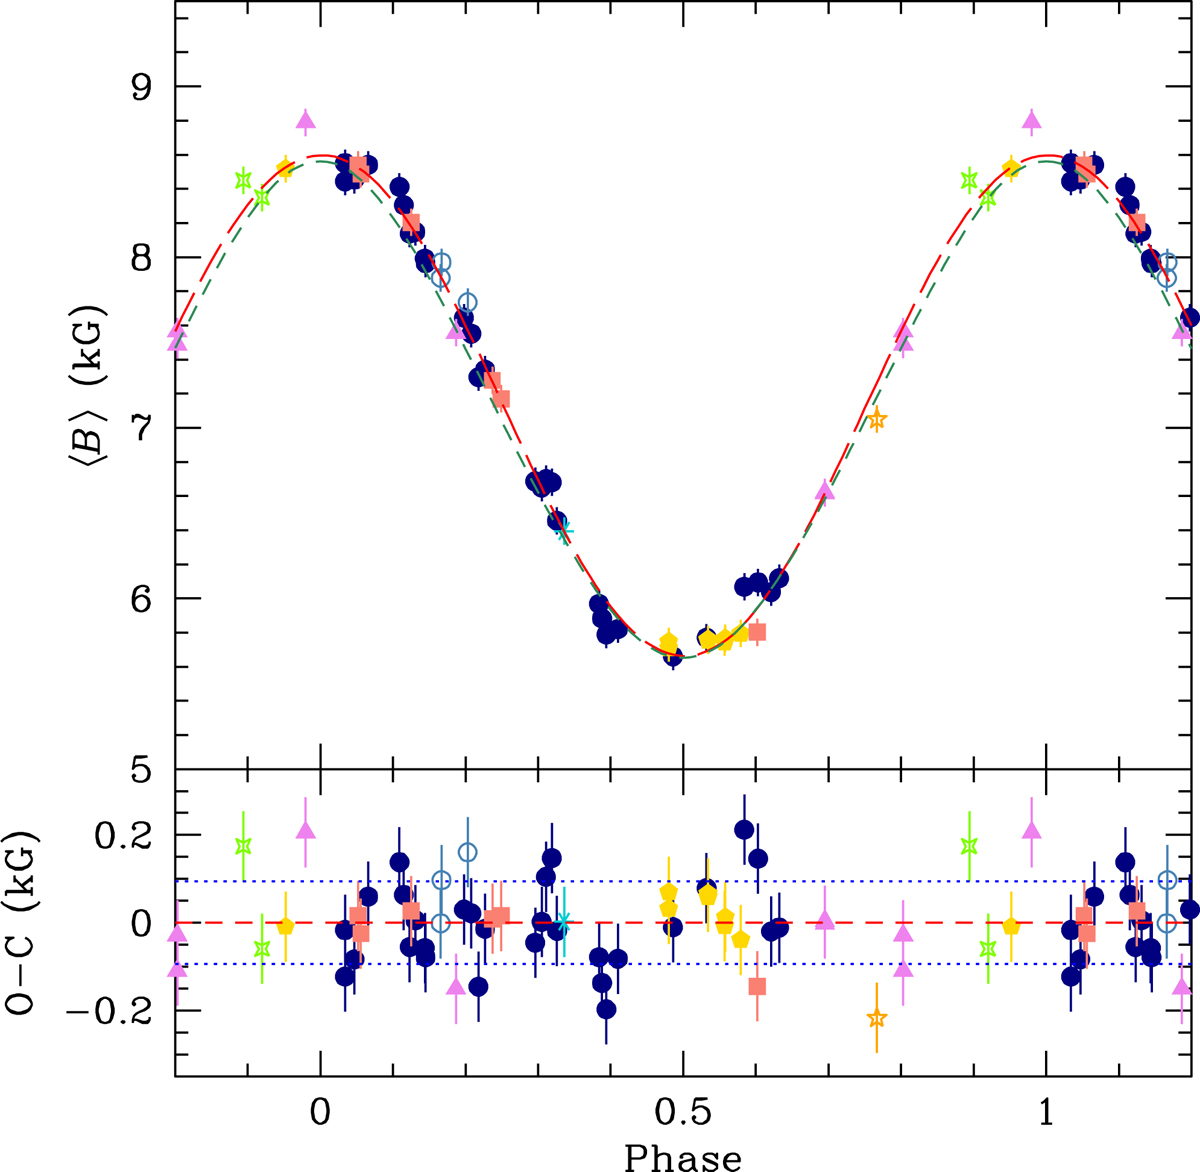
Upper panel: mean magnetic field modulus of HD 166473 against rotation phase. The different symbols identify the instrumental configuration from which the ⟨B⟩ value was obtained, as follows: filled circles (dark blue): CAT + CES LC; asterisk (turquoise): CAT + CES LC, lower resolution; open circle (steel blue): CAT + CES SC; filled triangles (violet): CFHT + Gecko (all previous symbols identical to Mathys 2017); five-pointed open star (orange): 3.6 m + CES VLC; four-pointed open stars (light green): UT2 + UVES; filled pentagons (yellow): 3.6 m + HARPS; filled squares (salmon): CFHT + ESPaDOnS. The long-dashed line (red) is the best fit of the observations by a cosine wave (see Eq. (4)). The short-dashed line (dark green) corresponds to the superposition of low-order multipoles discussed in Sect. 4. Lower panel: differences O–C between the individual ⟨B⟩ measurements and the best-fit curve, against rotation phase. The dotted lines (blue) correspond to ±1 rms deviation of the observational data about the fit (red dashed line). The symbols are the same as in the upper panel.
Current usage metrics show cumulative count of Article Views (full-text article views including HTML views, PDF and ePub downloads, according to the available data) and Abstracts Views on Vision4Press platform.
Data correspond to usage on the plateform after 2015. The current usage metrics is available 48-96 hours after online publication and is updated daily on week days.
Initial download of the metrics may take a while.