Fig. A.10.
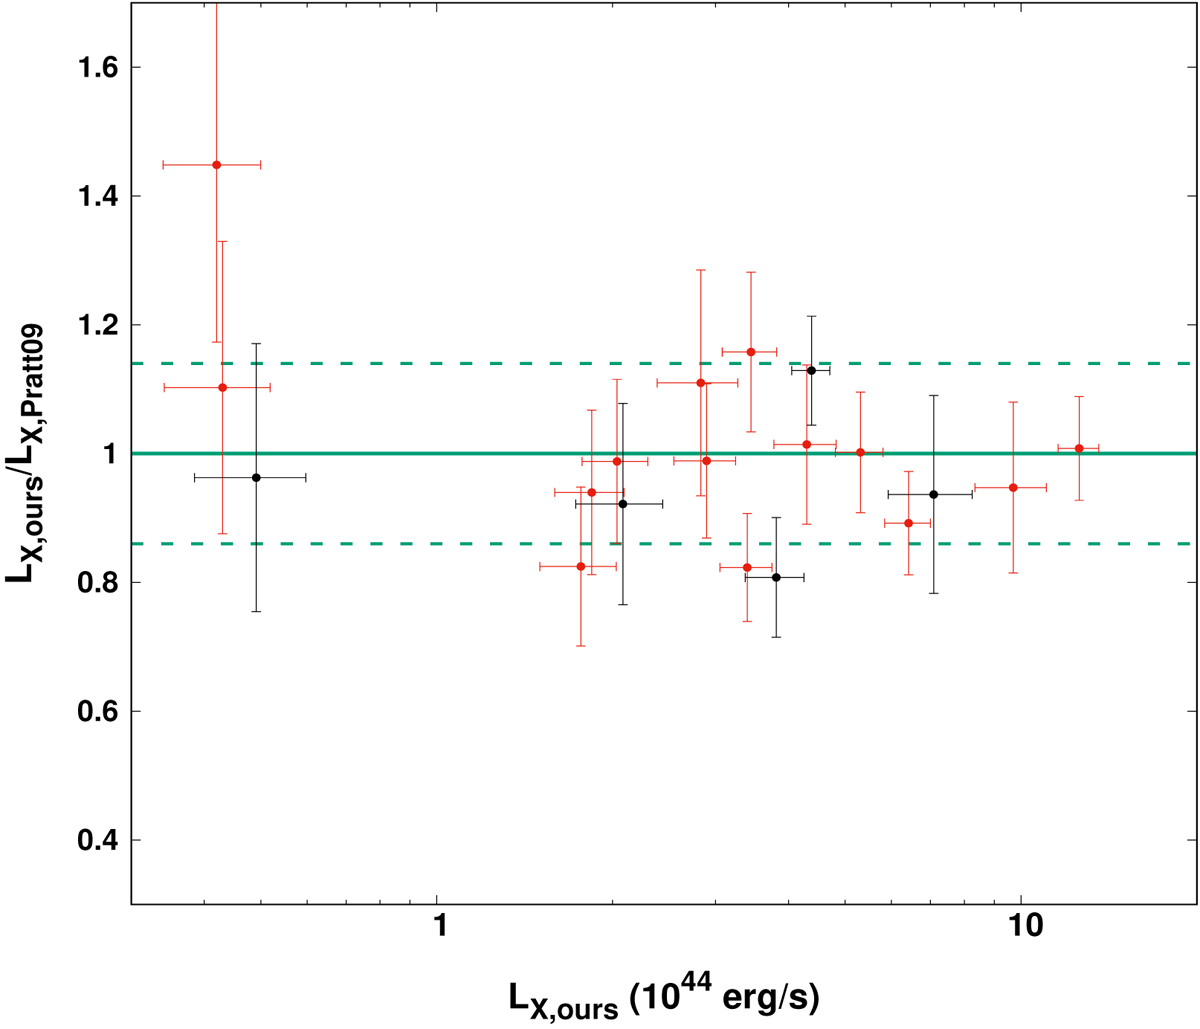
Fraction of the LX, ours used in this analysis over the ones derived in Pratt et al. (2009) (LX, Pratt09) for the 19 common clusters between the two samples. The clusters lying in statistically significant low A regions are displayed with black. Also, the equality line is displayed (solid green) with its 1σ scatter (dashed green).
Current usage metrics show cumulative count of Article Views (full-text article views including HTML views, PDF and ePub downloads, according to the available data) and Abstracts Views on Vision4Press platform.
Data correspond to usage on the plateform after 2015. The current usage metrics is available 48-96 hours after online publication and is updated daily on week days.
Initial download of the metrics may take a while.