Free Access
Fig. 22.
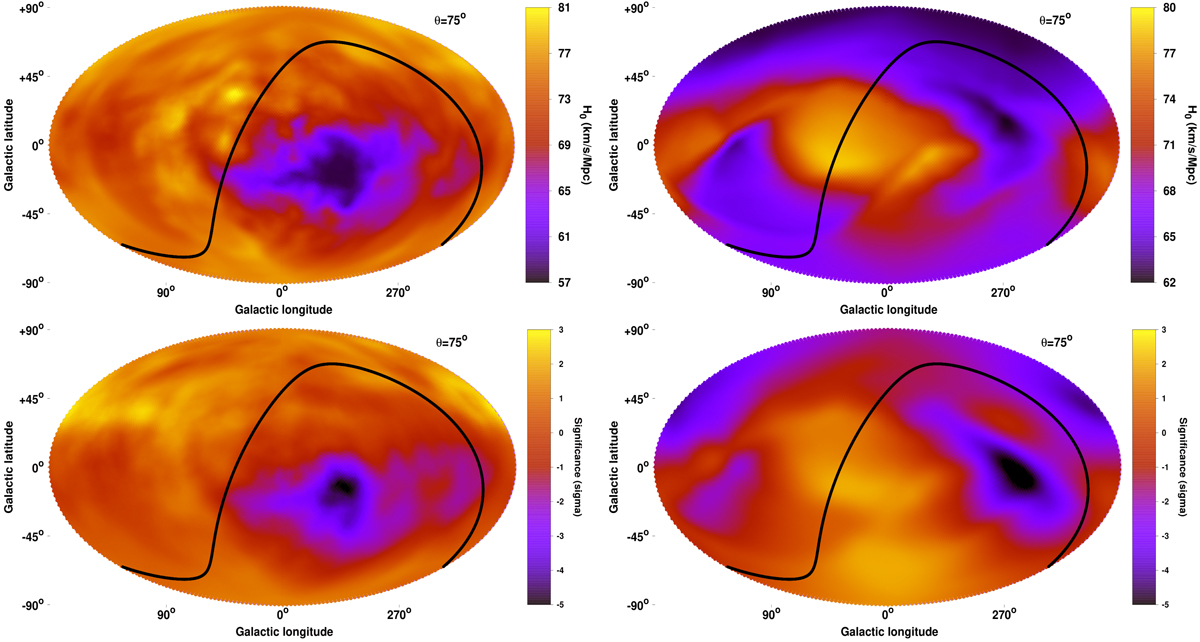
Top: best-fit H0 value as a function of the position in the extragalactic sky for θ = 75° cones for ACC (left) and XCS-DR1 (right). Bottom: significance map of the anisotropy between every sky region and the rest of the sky for ACC (left) and XCS-DR1 (right).
Current usage metrics show cumulative count of Article Views (full-text article views including HTML views, PDF and ePub downloads, according to the available data) and Abstracts Views on Vision4Press platform.
Data correspond to usage on the plateform after 2015. The current usage metrics is available 48-96 hours after online publication and is updated daily on week days.
Initial download of the metrics may take a while.