Free Access
Fig. 16.
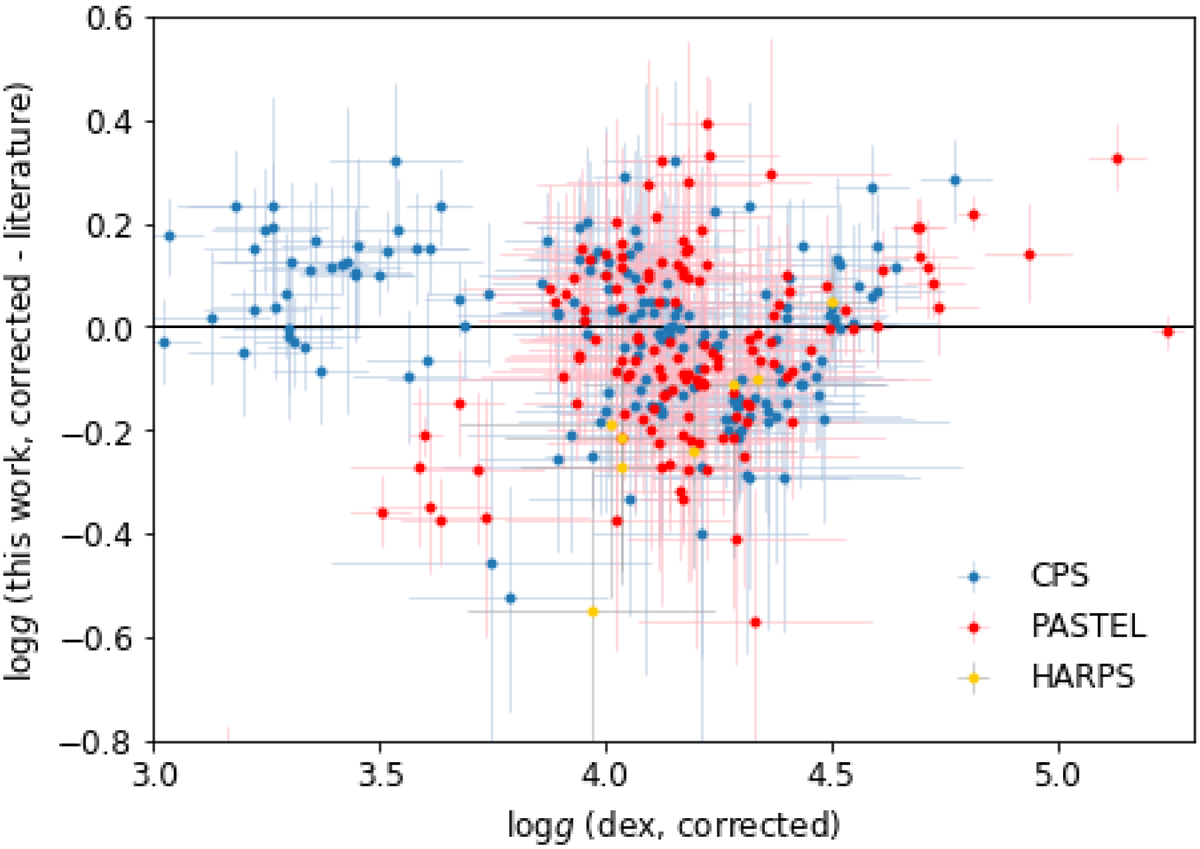
Diagram plotting the output log gcor of our pipeline against the difference between it and the values published by CPS, PASTEL, and the HARPS-GTO program. Errors included are our pipeline’s estimates using the covariance matrix.
Current usage metrics show cumulative count of Article Views (full-text article views including HTML views, PDF and ePub downloads, according to the available data) and Abstracts Views on Vision4Press platform.
Data correspond to usage on the plateform after 2015. The current usage metrics is available 48-96 hours after online publication and is updated daily on week days.
Initial download of the metrics may take a while.