Free Access
Fig. 6.
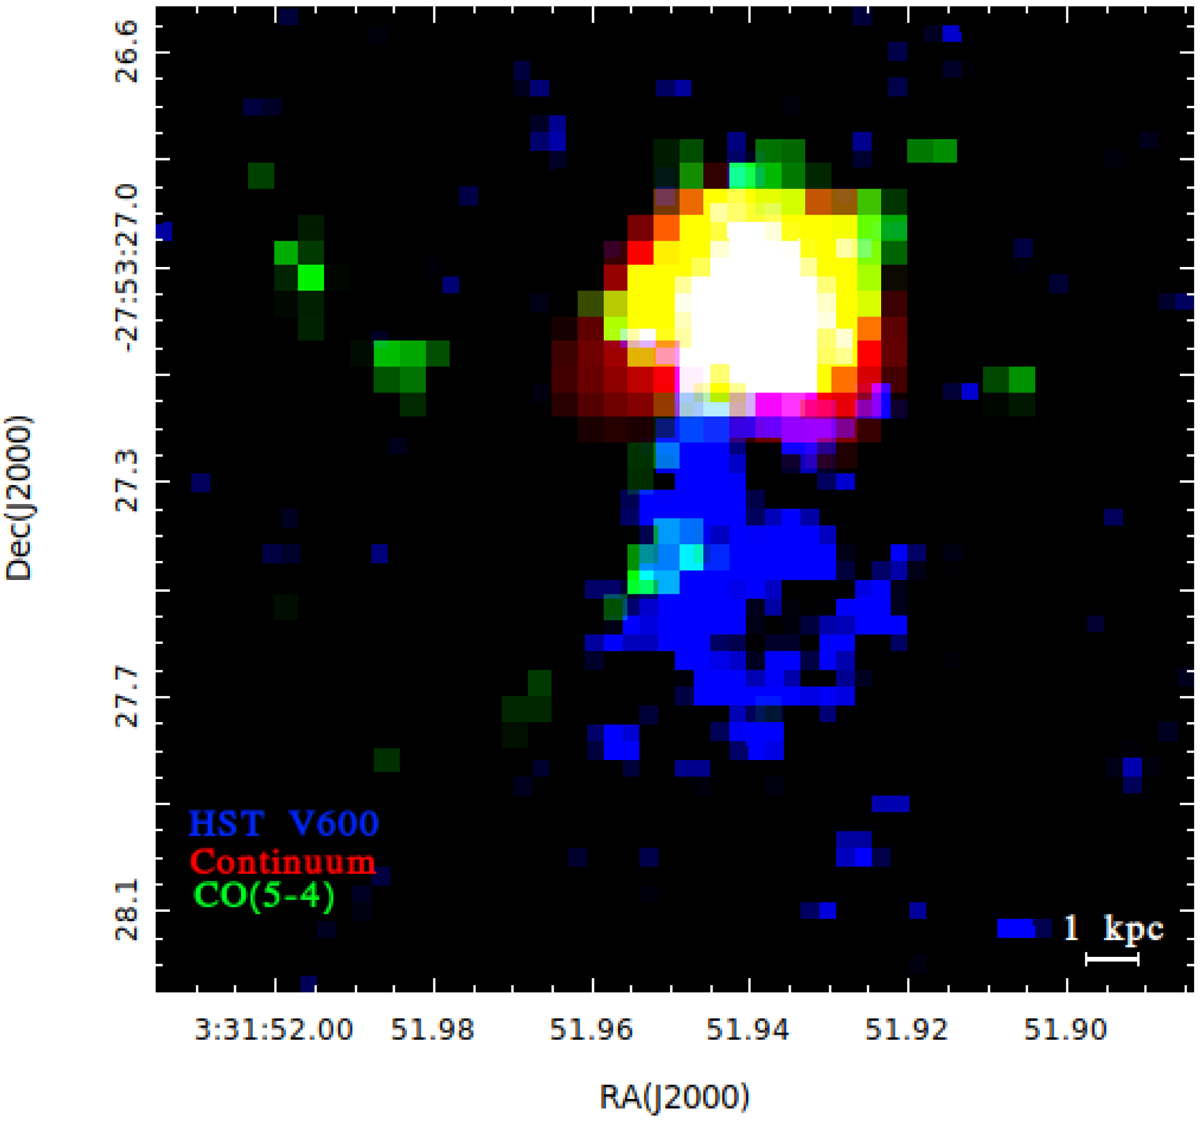
Composed r-g-b image of XID 42: the red, green and blue channels are the dust continuum, CO integrated flux and HST V600 image, respectively. In the bottom-right corner the physical scale is reported.
Current usage metrics show cumulative count of Article Views (full-text article views including HTML views, PDF and ePub downloads, according to the available data) and Abstracts Views on Vision4Press platform.
Data correspond to usage on the plateform after 2015. The current usage metrics is available 48-96 hours after online publication and is updated daily on week days.
Initial download of the metrics may take a while.