Fig. 4.
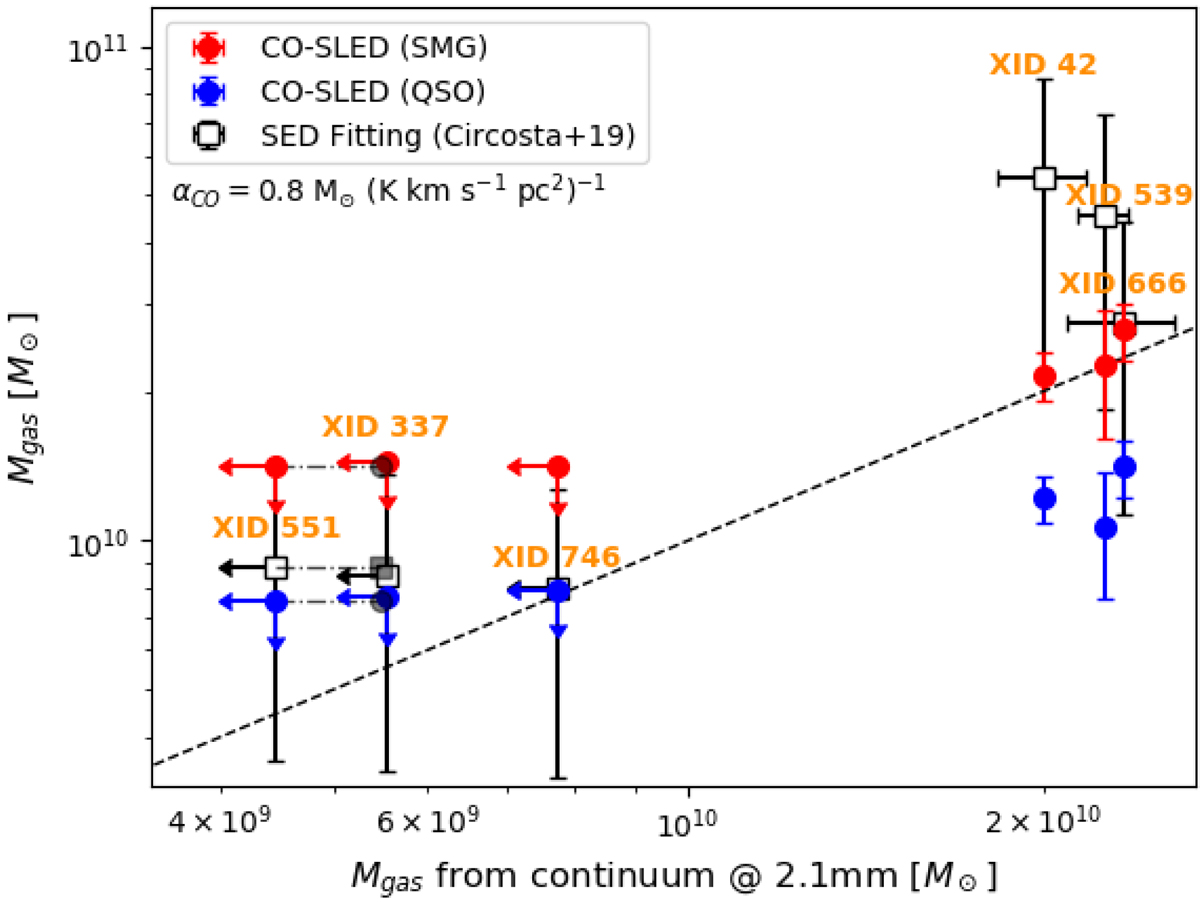
Gas mass derived from the dust emission (x-axis) vs. gas mass derived from the CO line (y-axis). We used αCO = 0.8 to calculate the molecular gas mass from both the line and continuum emission, which have been previously converted into ![]() assuming different CO-SLEDs (SMG, red filled circles and QSO, blue filled circles) for the line, and the
assuming different CO-SLEDs (SMG, red filled circles and QSO, blue filled circles) for the line, and the ![]() empirical relation from Scoville et al. (2016, see left panel of their Fig. 1) for the continuum. We accounted for the atomic mass assuming it is 1/5 of the molecular mass. We also report on the y-axis (black open squares) the gas mass derived from the SED fitting by Circosta et al. (2019). The source IDs are reported in orange. For clarity, we slightly shifted the datapoints of XID 551 toward the left, as they would overlap with those of XID 337 (black shaded symbols). In addition, we report the horizontal error bars of the gas mass derived from the dust emission only on the black open squares. The black dashed line represents the 1:1 relation.
empirical relation from Scoville et al. (2016, see left panel of their Fig. 1) for the continuum. We accounted for the atomic mass assuming it is 1/5 of the molecular mass. We also report on the y-axis (black open squares) the gas mass derived from the SED fitting by Circosta et al. (2019). The source IDs are reported in orange. For clarity, we slightly shifted the datapoints of XID 551 toward the left, as they would overlap with those of XID 337 (black shaded symbols). In addition, we report the horizontal error bars of the gas mass derived from the dust emission only on the black open squares. The black dashed line represents the 1:1 relation.
Current usage metrics show cumulative count of Article Views (full-text article views including HTML views, PDF and ePub downloads, according to the available data) and Abstracts Views on Vision4Press platform.
Data correspond to usage on the plateform after 2015. The current usage metrics is available 48-96 hours after online publication and is updated daily on week days.
Initial download of the metrics may take a while.