Fig. 2.
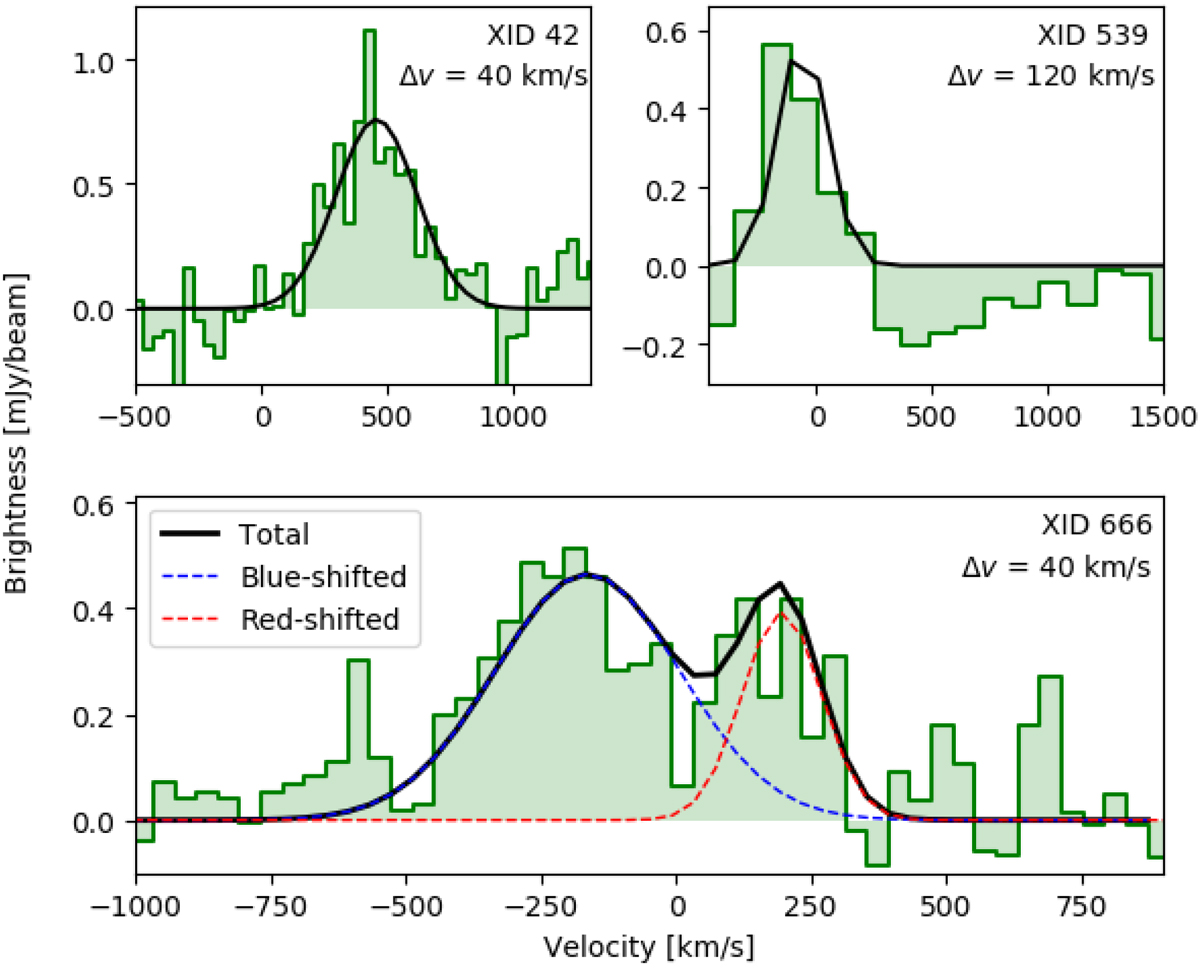
Spectrum of XID 42, XID 539 and XID 666 (green shaded histogram), expressed as the mean brightness within the regions contained in the blue ellipses of Fig. 1. The black solid line represents the Gaussian line fitting. Due to its double-peaked feature, we fit the line of XID 666 with two Gaussian components, indicated in the plot with the blue and red dashed lines. The channel width Δv is reported for each spectrum.
Current usage metrics show cumulative count of Article Views (full-text article views including HTML views, PDF and ePub downloads, according to the available data) and Abstracts Views on Vision4Press platform.
Data correspond to usage on the plateform after 2015. The current usage metrics is available 48-96 hours after online publication and is updated daily on week days.
Initial download of the metrics may take a while.