Fig. 13
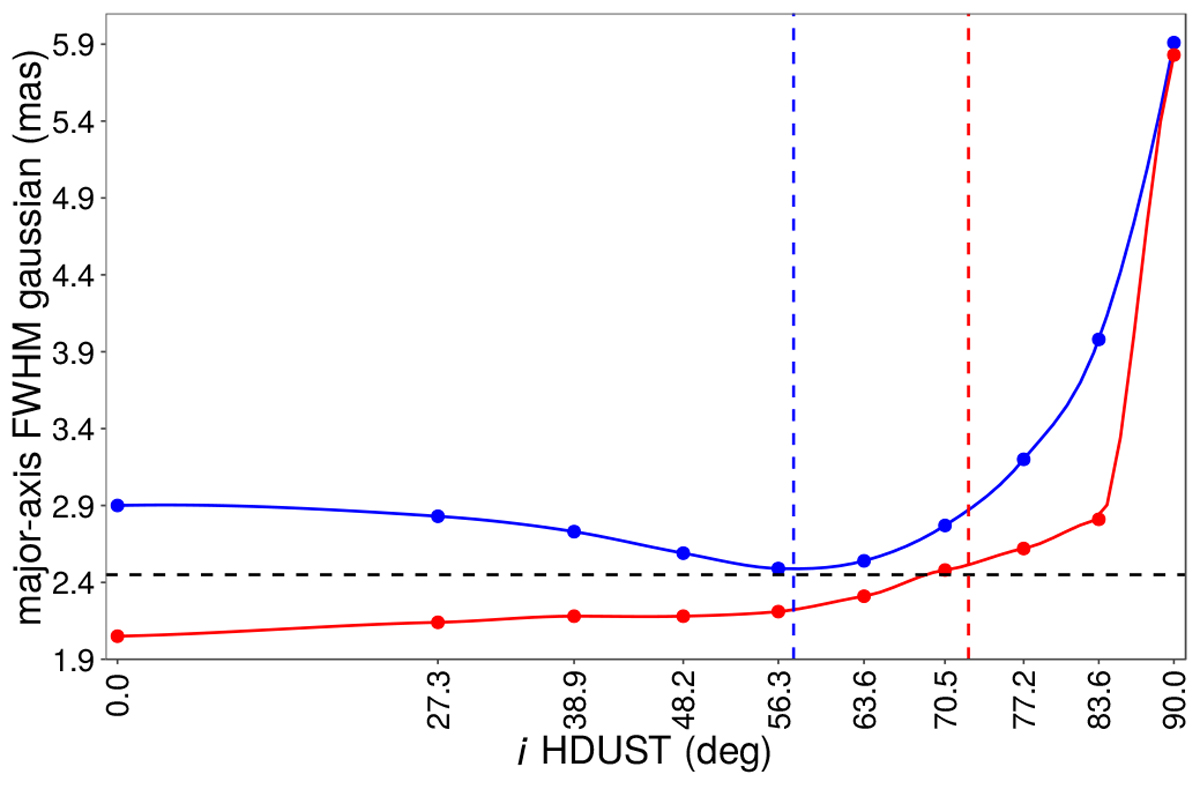
Major-axis FWHM of Gaussian distribution (fitted from our best-fit HDUST model) as a function of the HDUST inclination angle. All the other HDUST parameters are fixed. Blue points correspond to the fit in Hα and red points in Brγ. The vertical dashed lines mark our values for inclination angle derived from the HDUST analysis, fitting the data in Hα (blue) and Brγ (red). Note that the equivalent Gaussian fits show a similar extension (2.45 mas, marked in horizontal dashed line) for these values of i.
Current usage metrics show cumulative count of Article Views (full-text article views including HTML views, PDF and ePub downloads, according to the available data) and Abstracts Views on Vision4Press platform.
Data correspond to usage on the plateform after 2015. The current usage metrics is available 48-96 hours after online publication and is updated daily on week days.
Initial download of the metrics may take a while.