Fig. 6.
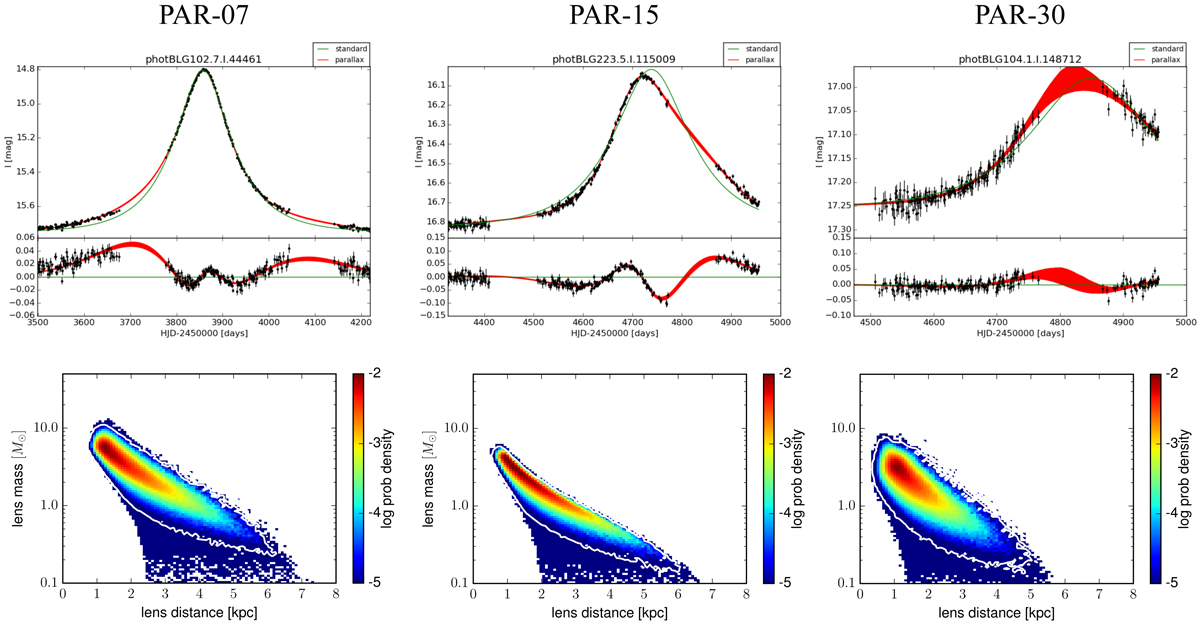
Microlensing events with mass estimates in the mass gap between 2 and 5 M⊙. Top panel: light curves with the standard model (green) and annual parallax model (red) derived with MCMC modelling, with residuals relative to the standard model plotted below. Bottom panel: mass-distance posterior probability densities along with the 95% confidence level contour.
Current usage metrics show cumulative count of Article Views (full-text article views including HTML views, PDF and ePub downloads, according to the available data) and Abstracts Views on Vision4Press platform.
Data correspond to usage on the plateform after 2015. The current usage metrics is available 48-96 hours after online publication and is updated daily on week days.
Initial download of the metrics may take a while.