Free Access
Fig. 10
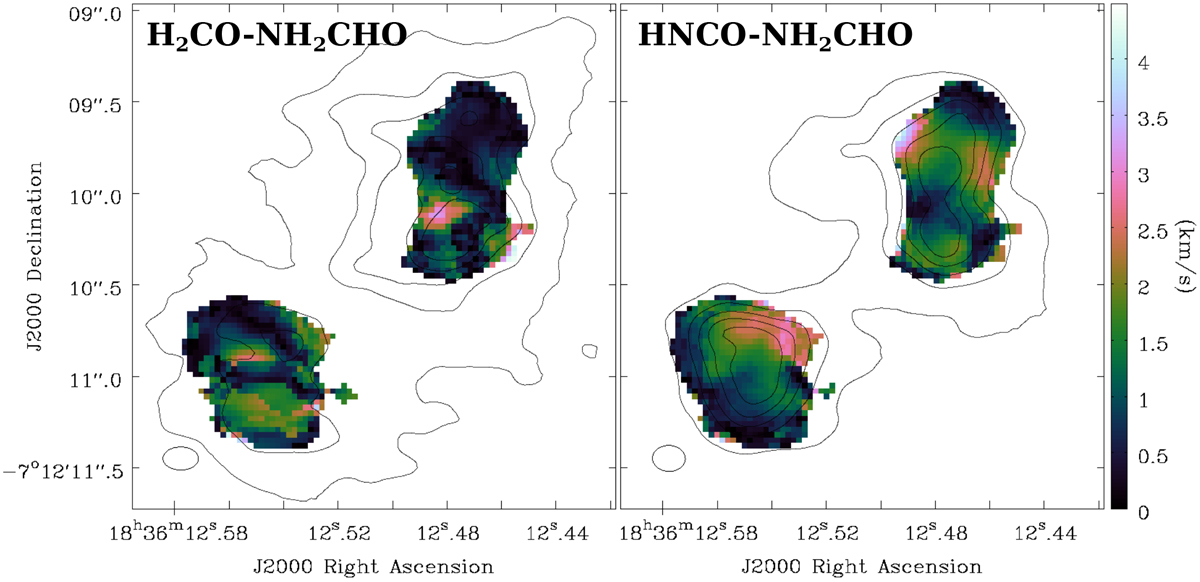
Velocity difference (from first moment maps) at each pixel in G24 between (left) H2CO (3) and NH2CHO (2) and (right) HNCO (1) and NH2CHO (2). The contours show the integrated intensity maps for H2CO (3) and HNCO (1) as in Fig. 5. The velocity scale is the same for both panels.
Current usage metrics show cumulative count of Article Views (full-text article views including HTML views, PDF and ePub downloads, according to the available data) and Abstracts Views on Vision4Press platform.
Data correspond to usage on the plateform after 2015. The current usage metrics is available 48-96 hours after online publication and is updated daily on week days.
Initial download of the metrics may take a while.