Fig. A.1.
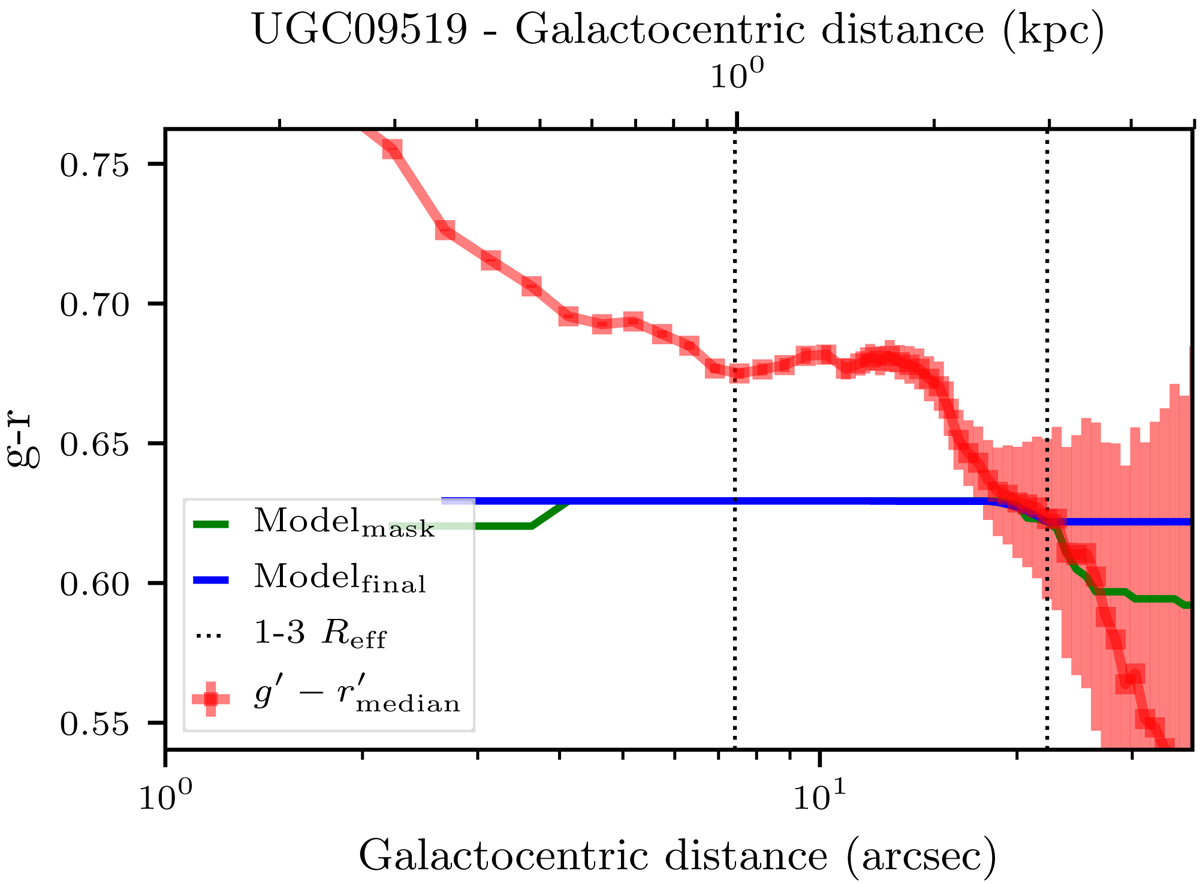
Radial profiles for the g′−r′ images and the two models obtained in our dust-free colour calculation process. The red profile shows the median colour value of the original annuli. The green line shows the model, which follows the requirement that the colour cannot get redder with increasing radius (see text). The blue profile shows the final model, which is flat before 0.5 Reff, and after 3 Reff. The dotted vertical lines indicate 1 Reff and 3 Reff, respectively.
Current usage metrics show cumulative count of Article Views (full-text article views including HTML views, PDF and ePub downloads, according to the available data) and Abstracts Views on Vision4Press platform.
Data correspond to usage on the plateform after 2015. The current usage metrics is available 48-96 hours after online publication and is updated daily on week days.
Initial download of the metrics may take a while.