Fig. 5.
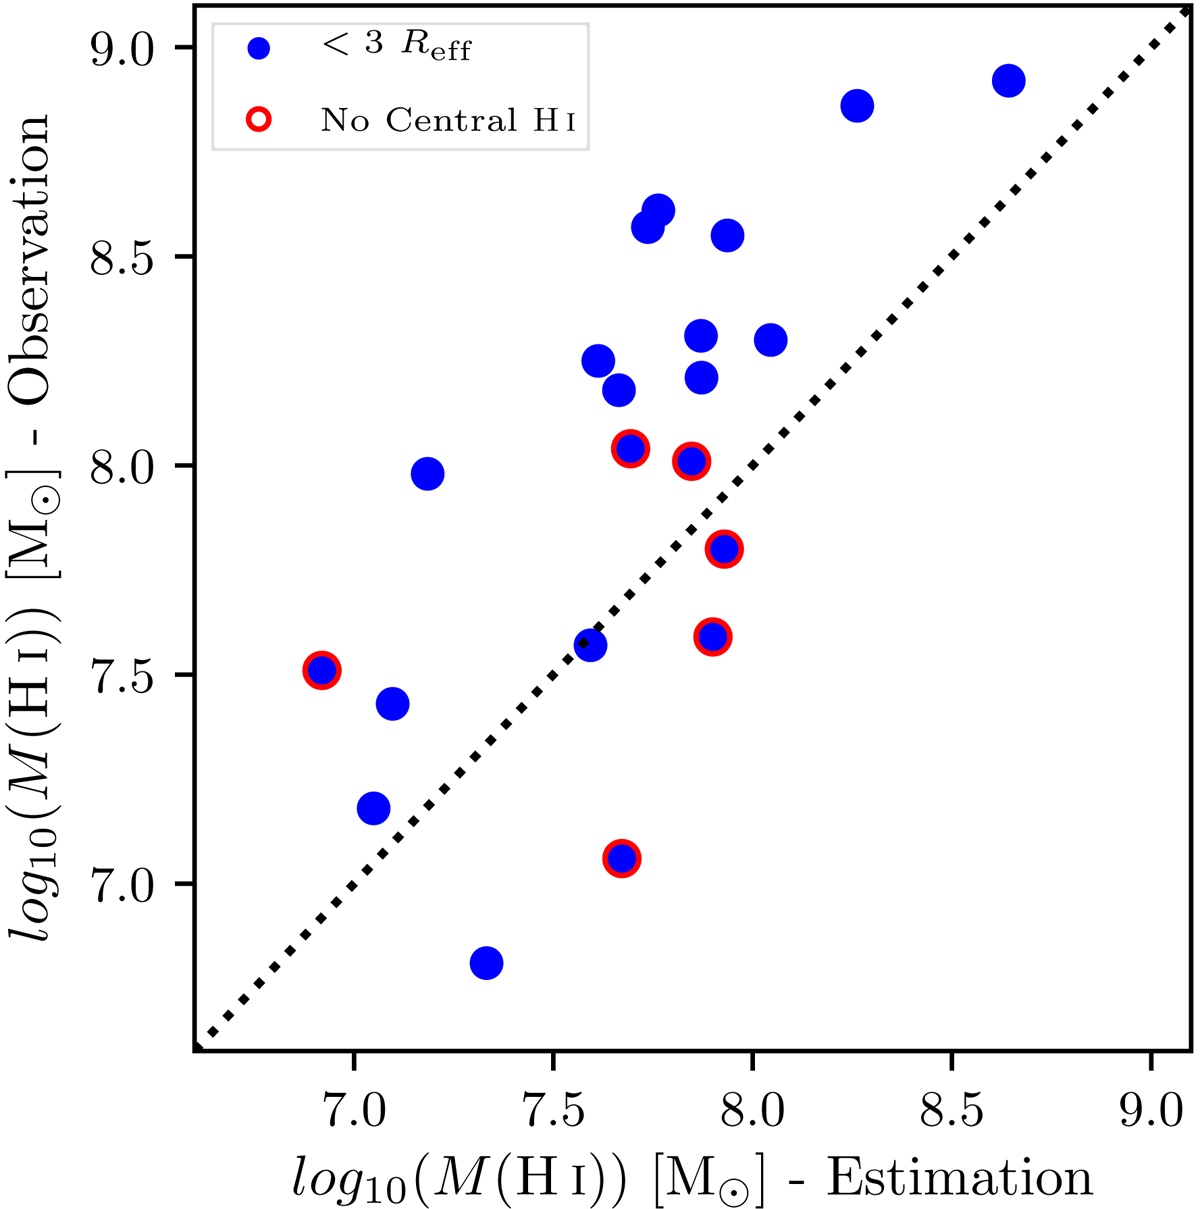
Observed H I mass vs. the H I mass estimated based on the colour excess (see text). The observed H I mass was calculated based on the H I images in Serra et al. (2012) within the same region where we detected a colour excess. The dotted line shows the one-to-one relation. Red outer circles indicate galaxies with no central H I (< 1 Reff).
Current usage metrics show cumulative count of Article Views (full-text article views including HTML views, PDF and ePub downloads, according to the available data) and Abstracts Views on Vision4Press platform.
Data correspond to usage on the plateform after 2015. The current usage metrics is available 48-96 hours after online publication and is updated daily on week days.
Initial download of the metrics may take a while.