Fig. 2.
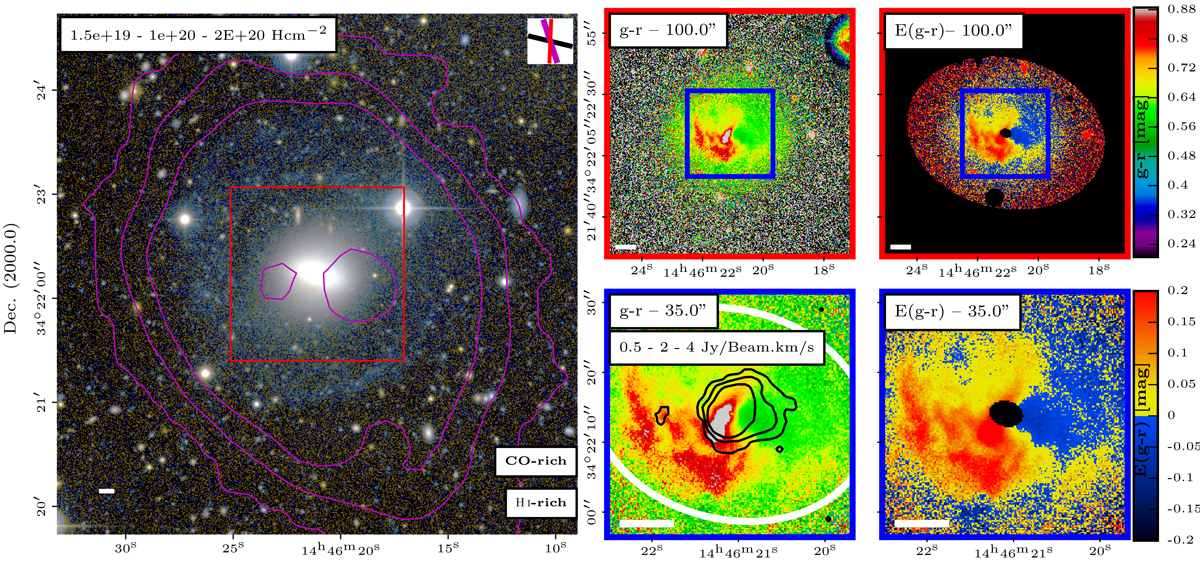
Left: true colour image of UGC 09519 with overlaid H I column density contours (magenta; see top-left box for the contour levels). The size of the true colour image is 300 × 300 arcsec2. Top-middle: g′−r′ image covering 100 × 100 arcsec2 area indicated in the left panel with a red box. Top-right: E(g′−r′) colour excess map (100 × 100 arcsec2). Bottom-middle: g′−r′ image covering the 35 × 35 arcsec2 area indicated in the top-middle panel with a blue box. Since CO is generally detected in the inner regions, we show the CO intensity contours with black lines in this panel (see Alatalo et al. 2013). The white ellipse indicates the dust radius determined through visual inspection (see Table 3). Bottom-right: E(g′−r′) colour excess map (35 × 35 arcsec2). The contour levels are indicated in the relevant panels. The white bar in the panels represents 1 kpc. On the top-right corner of the left panel, we also present the position angles as in Fig. 1. See Appendix C for the rest of the sample.
Current usage metrics show cumulative count of Article Views (full-text article views including HTML views, PDF and ePub downloads, according to the available data) and Abstracts Views on Vision4Press platform.
Data correspond to usage on the plateform after 2015. The current usage metrics is available 48-96 hours after online publication and is updated daily on week days.
Initial download of the metrics may take a while.