Fig. 1.
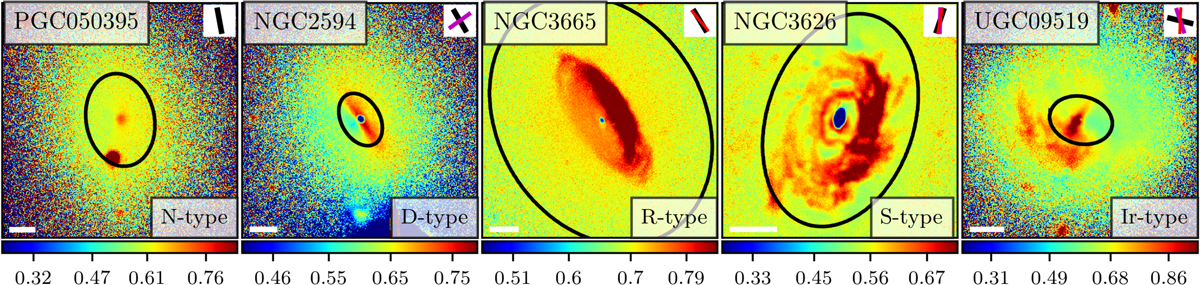
Example g′−r′ colour maps for our dust classification. The tick labels along the colour-bar indicate median−4σ, median−2σ, median, and median+2σ, respectively. The colour bars are limited between median−5σ and median+3σ. The median and standard deviation values of the g′−r′ colour are calculated in the region of 0−1 Reff, which is shown with the black ellipse. The white scale bar at the bottom corner indicates 1 kpc. On the top-right, we show an illustration of the position angles of the various galaxy components: in black the optical-disc from Krajnović et al. (2011); in purple the H I-disc from Serra et al. (2014); and in red the CO-disc from Alatalo et al. (2013). Similar g′−r′ colour maps of all of the galaxies studied here are shown in Appendix C.
Current usage metrics show cumulative count of Article Views (full-text article views including HTML views, PDF and ePub downloads, according to the available data) and Abstracts Views on Vision4Press platform.
Data correspond to usage on the plateform after 2015. The current usage metrics is available 48-96 hours after online publication and is updated daily on week days.
Initial download of the metrics may take a while.