Free Access
Fig. 3.
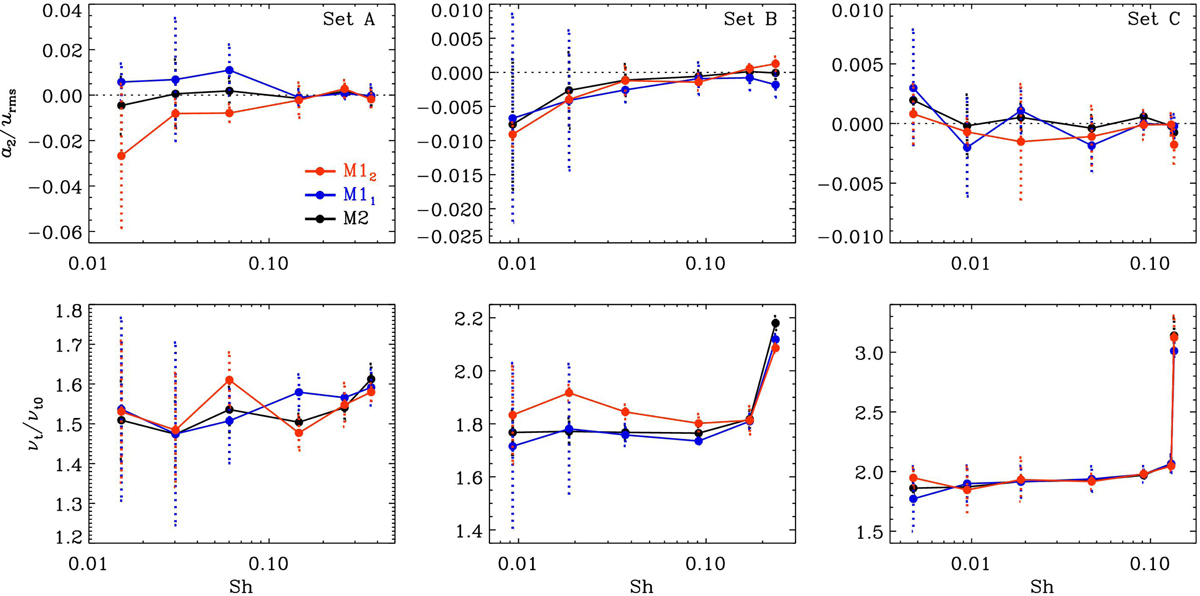
AKA–effect coefficient a2 (top) and turbulent viscosity νt (bottom) as functions of Sh for three scale separation ratios, 𝒮 = 3 (Set A, left), 5 (Set B, middle), and 10 (Set C, right). The colours refer to methods M1 (blue and red), and M2a (black). M11 and M12 refer to the two zeros employed in Eqs. (23) and (24).
Current usage metrics show cumulative count of Article Views (full-text article views including HTML views, PDF and ePub downloads, according to the available data) and Abstracts Views on Vision4Press platform.
Data correspond to usage on the plateform after 2015. The current usage metrics is available 48-96 hours after online publication and is updated daily on week days.
Initial download of the metrics may take a while.