Fig. 3.
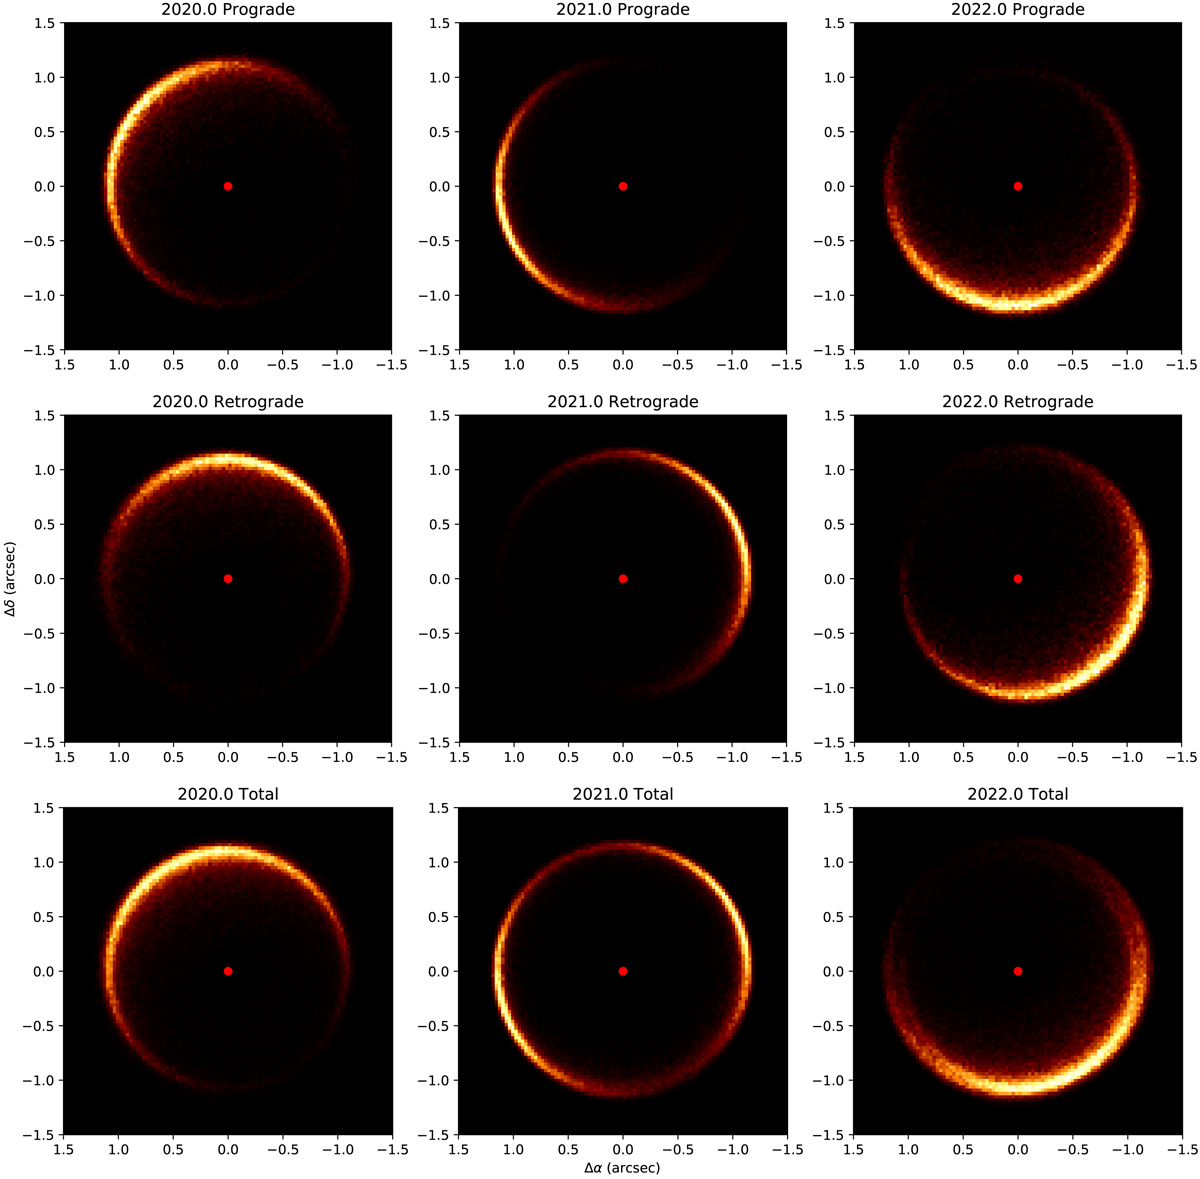
Maps of the probability of presence of Proxima c relative to its parent star for epochs 2020.0, 2021.0, and 2022.0. The maps are presented for the prograde solution (top row), the retrograde solution (middle row), and the cumulated probability of presence with no assumption on the orbital direction (bottom row). The color scale is linear and arbitrarily normalized to the maximum probability in the field at each epoch.
Current usage metrics show cumulative count of Article Views (full-text article views including HTML views, PDF and ePub downloads, according to the available data) and Abstracts Views on Vision4Press platform.
Data correspond to usage on the plateform after 2015. The current usage metrics is available 48-96 hours after online publication and is updated daily on week days.
Initial download of the metrics may take a while.