Fig. 2.
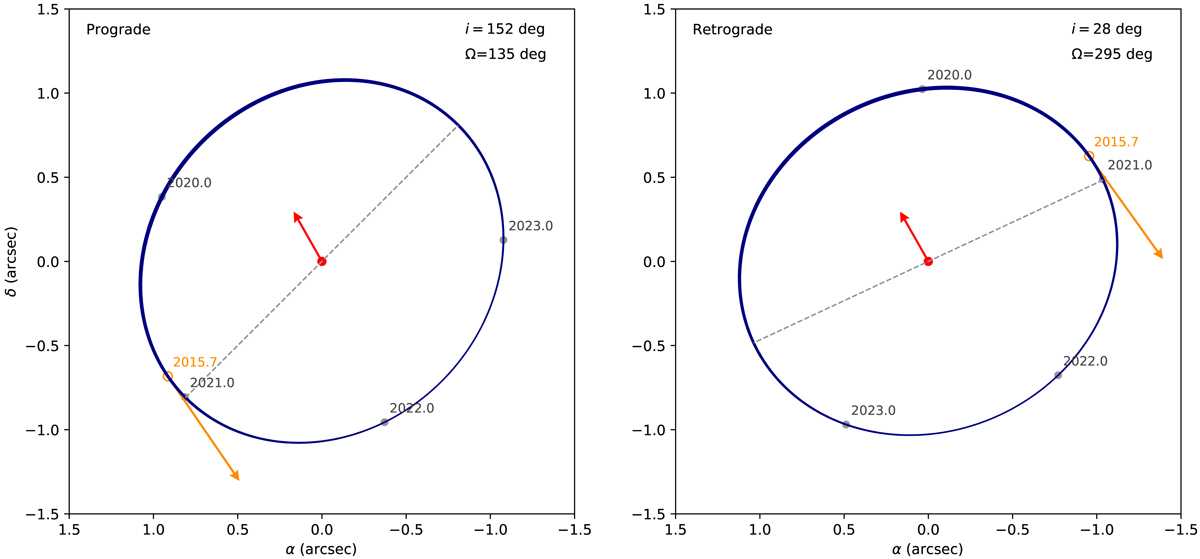
Orbital trajectories of Proxima c corresponding to the best-fit prograde (left panel) and retrograde (right panel) solutions (whose parameters are listed in Table 2). A thicker line indicates that the planet is closer to the Earth. The orange arrow shows the velocity vector of Proxima c at the effective GDR2 epoch, and the red arrow the corresponding reflex velocity of Proxima from its PMa (scaled by 10 000×).
Current usage metrics show cumulative count of Article Views (full-text article views including HTML views, PDF and ePub downloads, according to the available data) and Abstracts Views on Vision4Press platform.
Data correspond to usage on the plateform after 2015. The current usage metrics is available 48-96 hours after online publication and is updated daily on week days.
Initial download of the metrics may take a while.