Fig. 9.
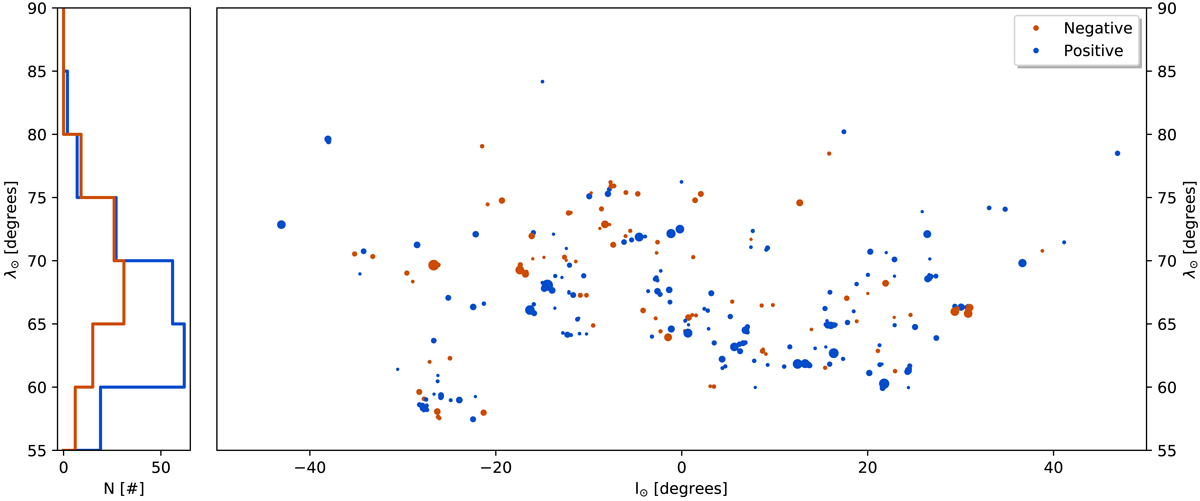
Spatial distribution of the magnetic patches observed in the north region. Right panel: solar heliospheric longitude and latitude distribution of the local reference magnetic flux for the magnetic patches found in the north region data set. Blue colour stands for positive (outgoing from the Sun) magnetic fields. Negative (ingoing to the Sun) magnetic fields are plotted in brown. The size of the dots is proportional to the decimal logarithm of the LRF flux of each patch. Left panel: histogram of the number of magnetic patches as a function of the solar latitude according to their LRF magnetic polarity. The colour code is preserved for the sake of clarity.
Current usage metrics show cumulative count of Article Views (full-text article views including HTML views, PDF and ePub downloads, according to the available data) and Abstracts Views on Vision4Press platform.
Data correspond to usage on the plateform after 2015. The current usage metrics is available 48-96 hours after online publication and is updated daily on week days.
Initial download of the metrics may take a while.