Fig. 5.
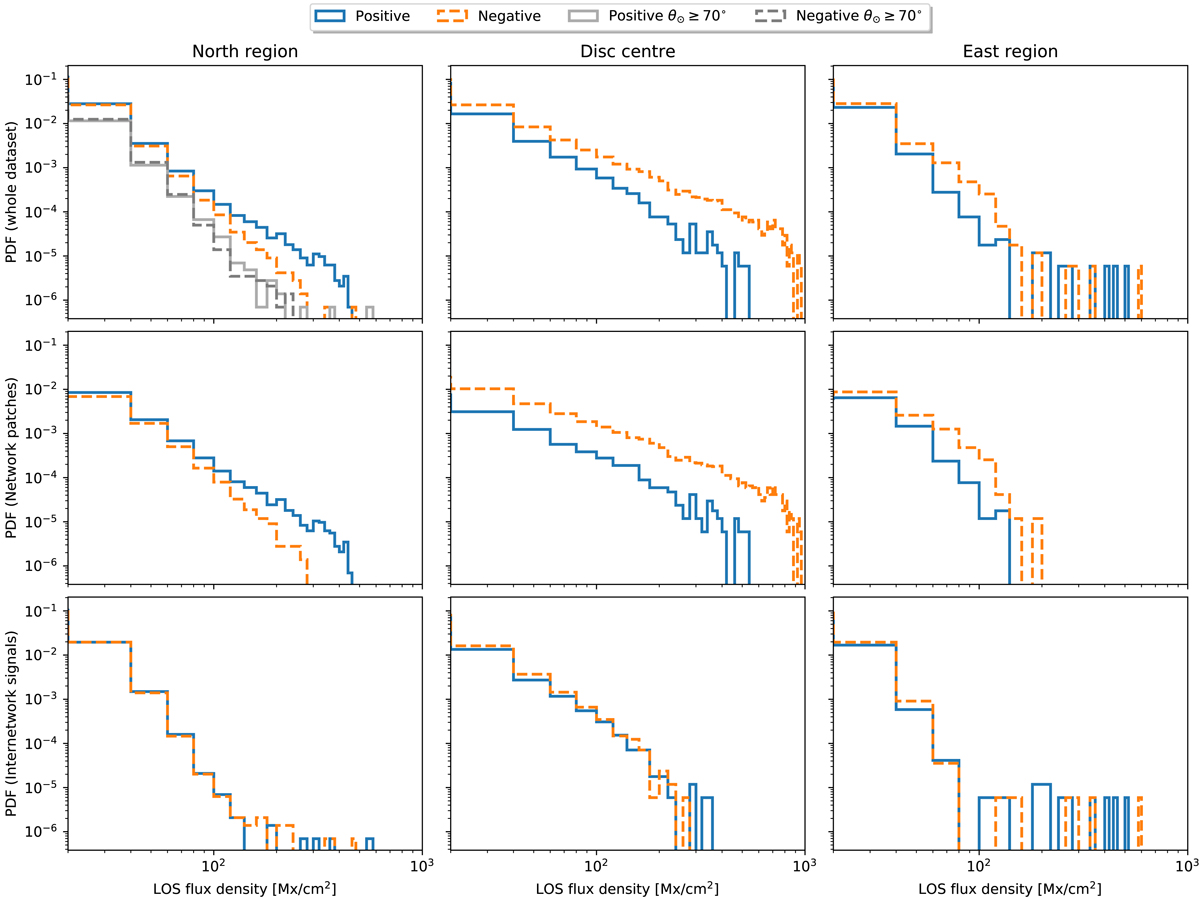
Line-of-sight magnetic flux inferred for the three QS regions. Top row, from left to right: LOS magnetic flux PDFs for north region, disc centre, and east-limb dataset. The positive tail is shown in solid blue, and the negative one is folded to positive values and shown by the orange dashed line. Middle panels: same representation for Network patches (see text for their definition) and bottom panels: for the rest of the magnetic signals. Top-left panel: includes two grey lines to show the LOS magnetic flux above 70° heliocentric angle.
Current usage metrics show cumulative count of Article Views (full-text article views including HTML views, PDF and ePub downloads, according to the available data) and Abstracts Views on Vision4Press platform.
Data correspond to usage on the plateform after 2015. The current usage metrics is available 48-96 hours after online publication and is updated daily on week days.
Initial download of the metrics may take a while.