Fig. 4.
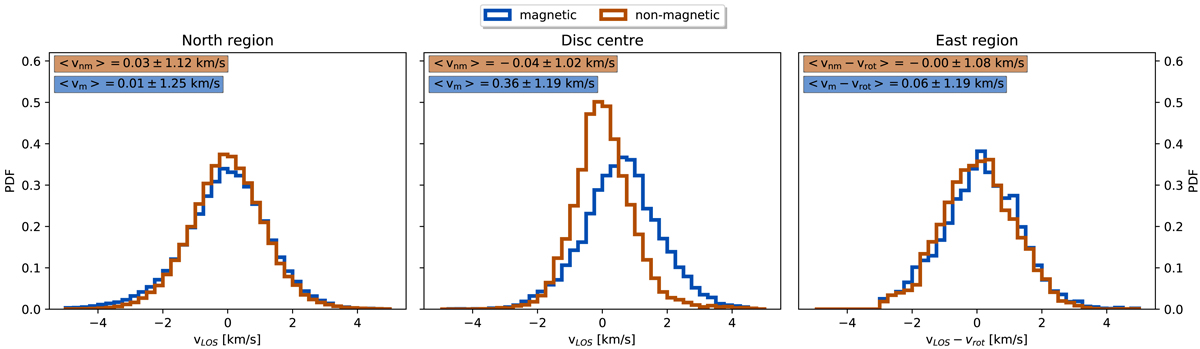
Line-of-sight velocity PDFs inferred for each QS region. From left to right: results for the north, disc centre, and east regions. The latter shows the actual inferred LOS velocity minus the projected rotational velocity to the LOS at these longitudes. The LOS velocities for the magnetic component are shown in blue and for the non-magnetic component in brown.
Current usage metrics show cumulative count of Article Views (full-text article views including HTML views, PDF and ePub downloads, according to the available data) and Abstracts Views on Vision4Press platform.
Data correspond to usage on the plateform after 2015. The current usage metrics is available 48-96 hours after online publication and is updated daily on week days.
Initial download of the metrics may take a while.