Fig. 1.
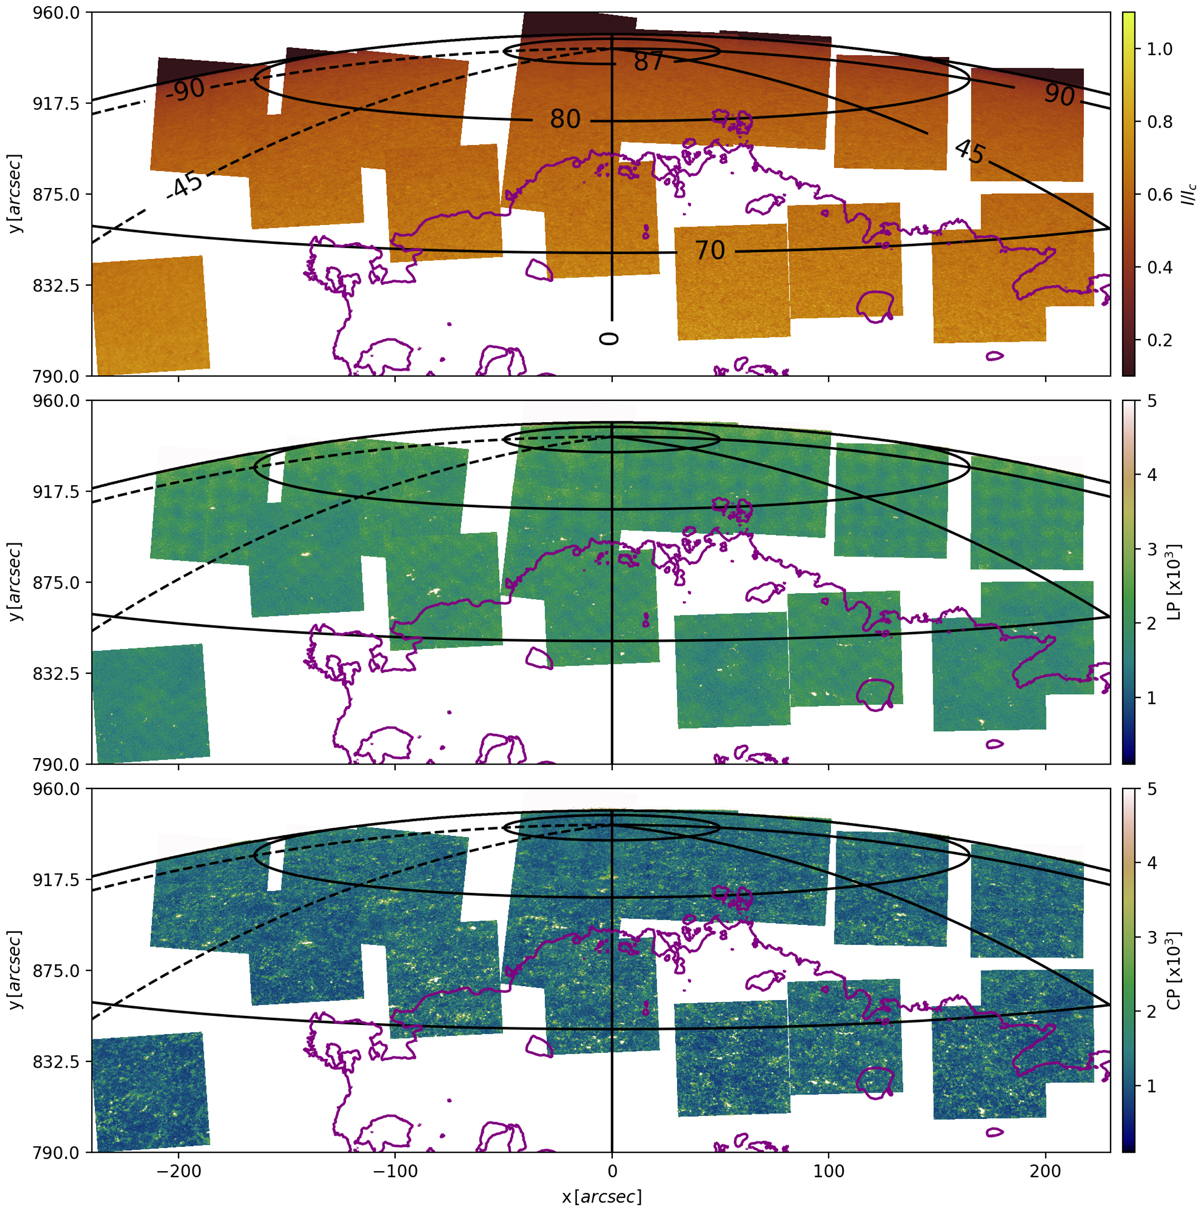
Mosaic of the north polar region with the 17 scans taken. The continuum intensity is shown in the upper panel, the linear polarisation map is shown in the middle panel, and the circular polarisation map is shown in the bottom panel. Linear polarisation is given by ![]() and circular polarisation is given by: ∫λ|V(λ)| dλ/∫λI(λ) dλ. The purple contour depicts the position of a coronal hole as estimated from the SDO/AIA 193 Å intensitygram.
and circular polarisation is given by: ∫λ|V(λ)| dλ/∫λI(λ) dλ. The purple contour depicts the position of a coronal hole as estimated from the SDO/AIA 193 Å intensitygram.
Current usage metrics show cumulative count of Article Views (full-text article views including HTML views, PDF and ePub downloads, according to the available data) and Abstracts Views on Vision4Press platform.
Data correspond to usage on the plateform after 2015. The current usage metrics is available 48-96 hours after online publication and is updated daily on week days.
Initial download of the metrics may take a while.