Free Access
Fig. 5.
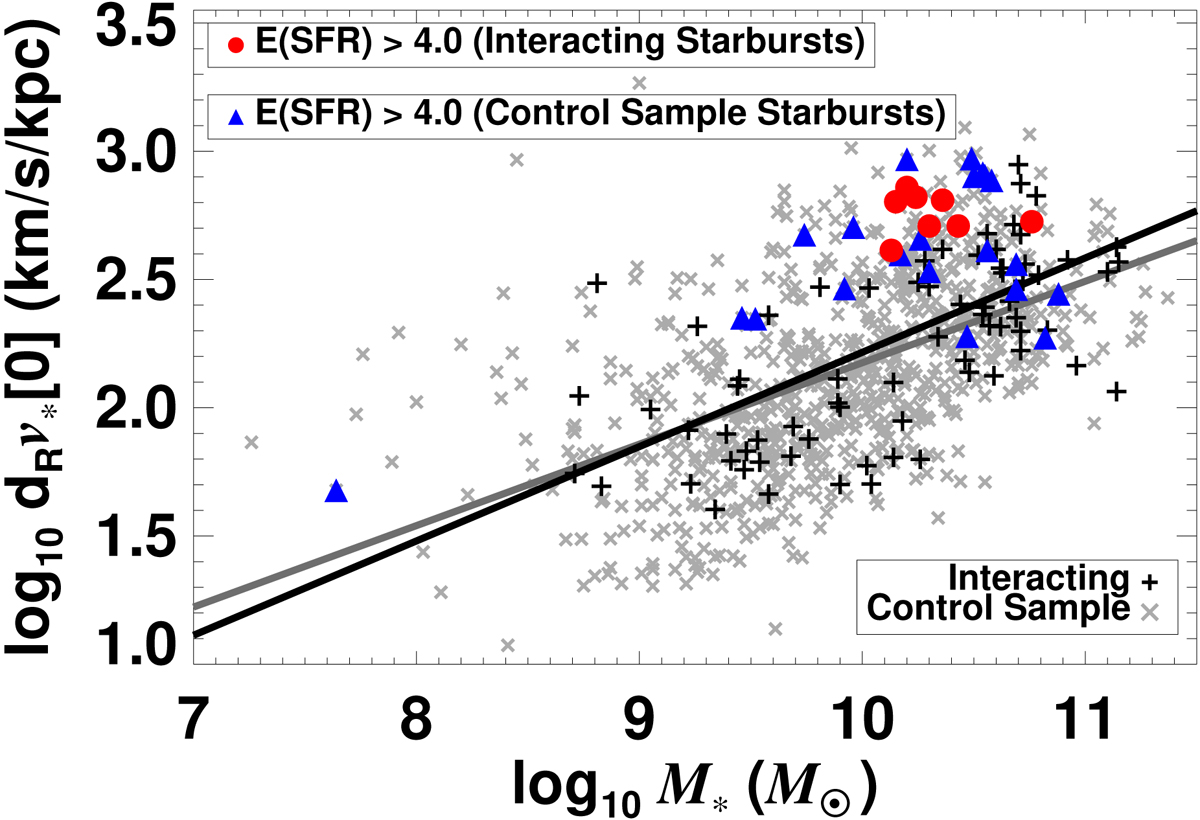
Inner slope of the stellar component of the rotation curve (direct measurement of the central stellar mass concentration) vs. total stellar mass for interacting (black) and non-interacting (grey) galaxies, while highlighting the starbursts (blue and red). The lines correspond to the linear fit to the data clouds.
Current usage metrics show cumulative count of Article Views (full-text article views including HTML views, PDF and ePub downloads, according to the available data) and Abstracts Views on Vision4Press platform.
Data correspond to usage on the plateform after 2015. The current usage metrics is available 48-96 hours after online publication and is updated daily on week days.
Initial download of the metrics may take a while.