Fig. 2.
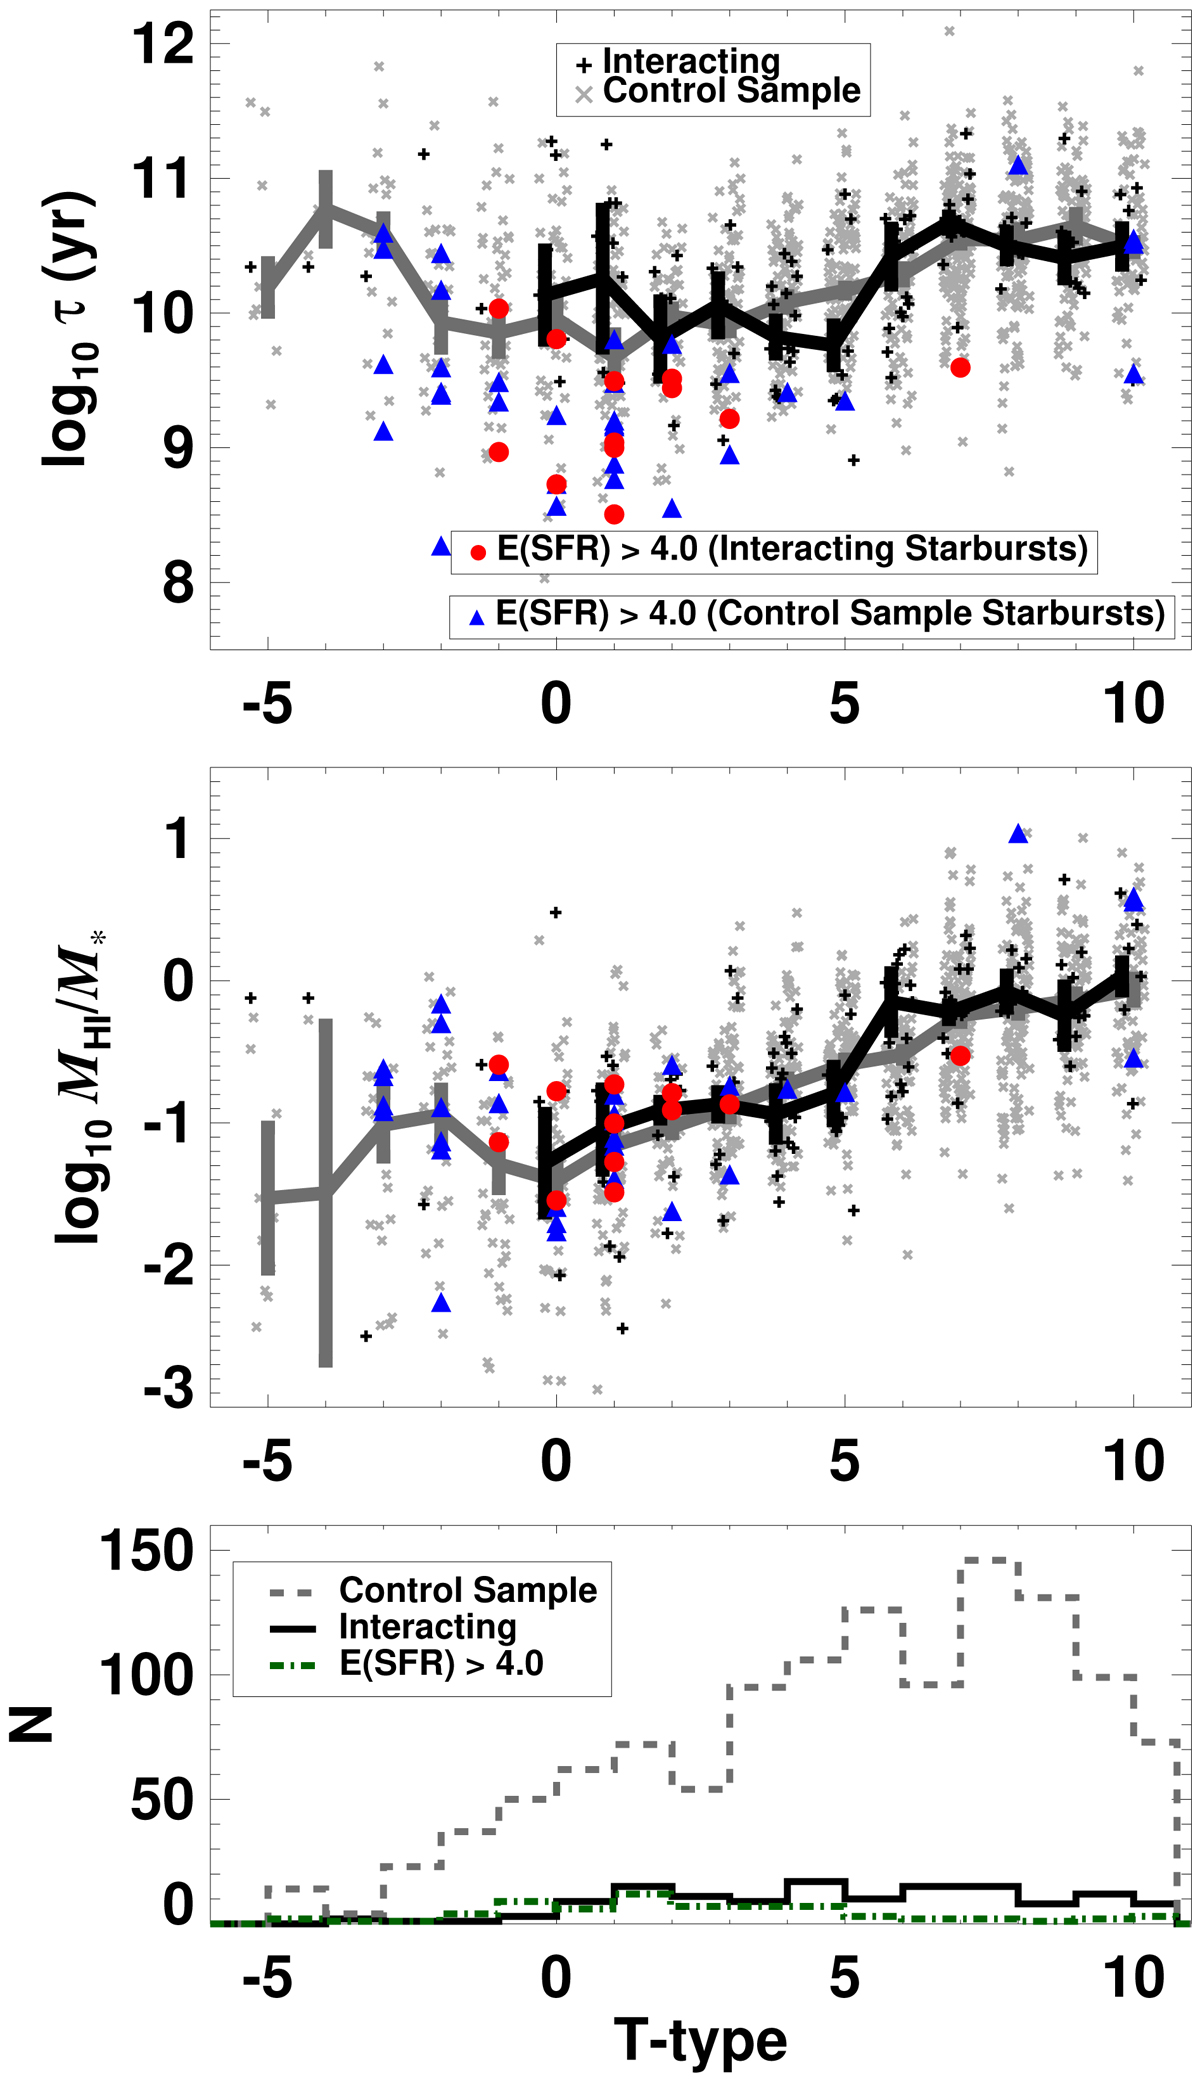
As in Fig. 1 but as a function of the revised Hubble stage. The running median (error bars obtained via bootstrap re-samplings) is shown for interacting (black) and non-interacting (grey) galaxies separately. In the upper and central panels we added small random offsets (≲0.3) to the T values in the x-axis (integers) to avoid point overlapping.
Current usage metrics show cumulative count of Article Views (full-text article views including HTML views, PDF and ePub downloads, according to the available data) and Abstracts Views on Vision4Press platform.
Data correspond to usage on the plateform after 2015. The current usage metrics is available 48-96 hours after online publication and is updated daily on week days.
Initial download of the metrics may take a while.