Free Access
Fig. 1
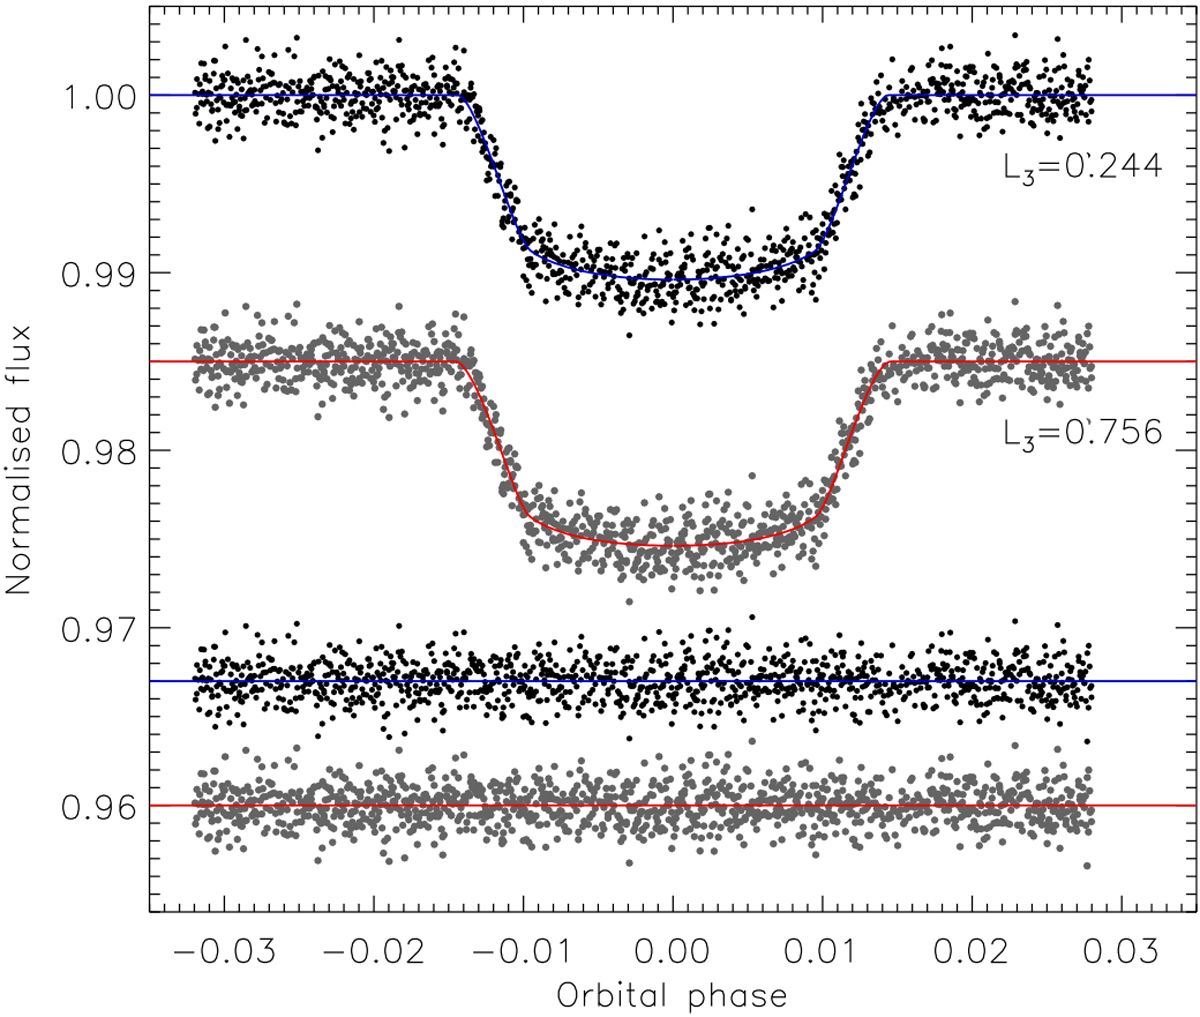
Fits to the TESS light curve of WASP-20. The observational data are shown as black and grey points. The JKTEBOP best fit for the planet transiting star A is the blue line, and for transiting star B is the red line. The residuals of the fits are shown at the base of the figure with arbitrary offsets from zero.
Current usage metrics show cumulative count of Article Views (full-text article views including HTML views, PDF and ePub downloads, according to the available data) and Abstracts Views on Vision4Press platform.
Data correspond to usage on the plateform after 2015. The current usage metrics is available 48-96 hours after online publication and is updated daily on week days.
Initial download of the metrics may take a while.