Fig. 9.
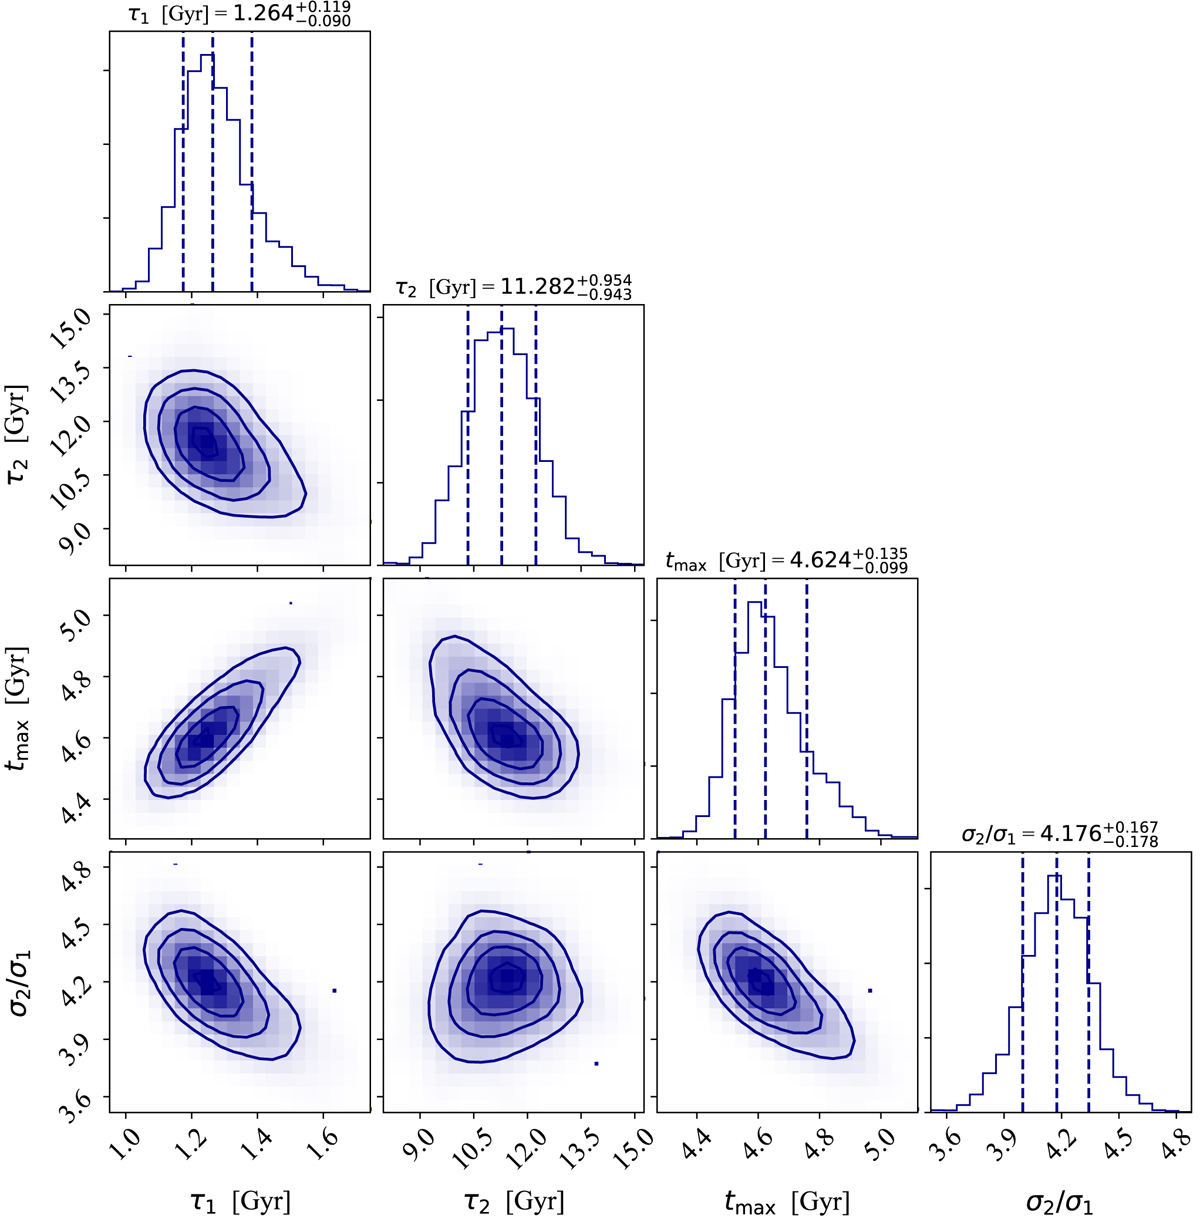
Corner plot showing the posterior PDFs of model M2 in which we adopt different SFEs for the high-α and low-α sequences: ν1 = 2 Gyr−1 and ν2 = 1 Gyr−1. The best fit of the 4D parameter space Θ = {τ1, τ2, tmax, σ2/σ1} is obtained by fitting [α/Fe], [Fe/H] and ages of the APOKASC sample (see model details in Sect. 5.1). The median, 16th and 84th percentiles of the posterior PDF are plotted for each parameter above the marginalised PDF.
Current usage metrics show cumulative count of Article Views (full-text article views including HTML views, PDF and ePub downloads, according to the available data) and Abstracts Views on Vision4Press platform.
Data correspond to usage on the plateform after 2015. The current usage metrics is available 48-96 hours after online publication and is updated daily on week days.
Initial download of the metrics may take a while.