Fig. 8.
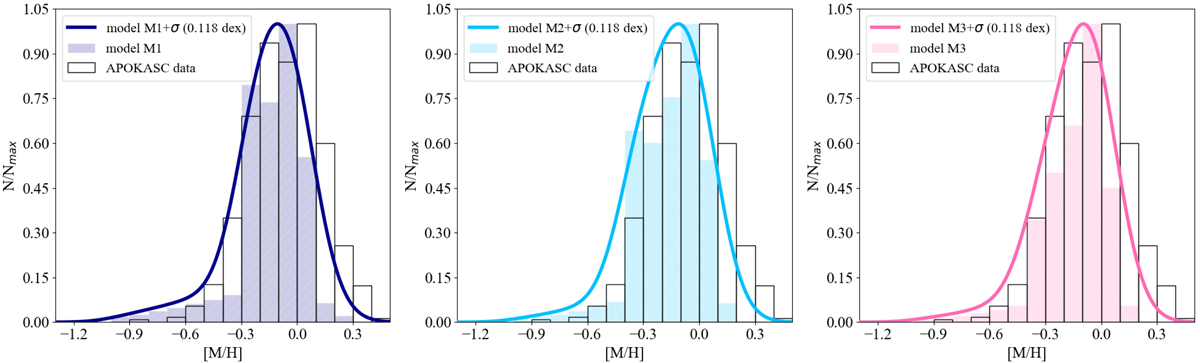
Metallicity distributions predicted by models M1 (left panel), M2 (middle panel), and M3 (right panel) with the best-fit model parameters (colored histograms). The observed APOKASC distribution calculated including both high-α and low-α stars is shown by the black empty histograms. The solid lines indicate the metallicity distribution of our chemical evolution models convolved with a Gaussian with standard deviation σ = 0.118 dex (average APOKASC data error). In each plot the distributions are normalised to the corresponding maximum number of stars Nmax.
Current usage metrics show cumulative count of Article Views (full-text article views including HTML views, PDF and ePub downloads, according to the available data) and Abstracts Views on Vision4Press platform.
Data correspond to usage on the plateform after 2015. The current usage metrics is available 48-96 hours after online publication and is updated daily on week days.
Initial download of the metrics may take a while.