Fig. 7.
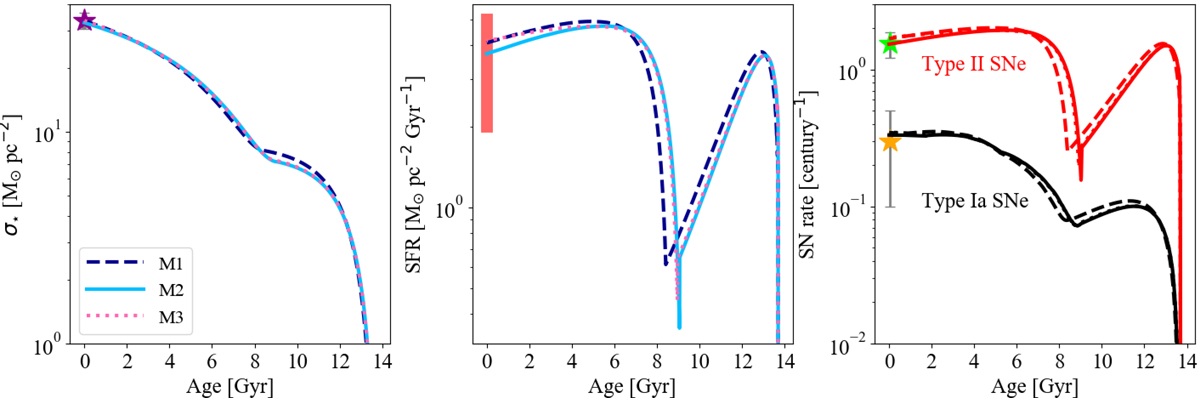
Left panel: stellar surface mass density σ⋆ evolution predicted by the best-fit models M1 (long dashed line), M2 (solid line), and M3 (dotted line). The purple star indicates the observed present-day value given by McKee et al. (2015). Middle panel: same as the left panel for SFR time evolution. The red shaded area indicates the measured range in the solar annulus suggested by Prantzos et al. (2018). Right panel: evolution of the Type Ia SN (black lines) and Type II SN (red lines) rates predicted by models M1, M2, and M3 for the whole Galactic disc. The yellow star stands for the observed Type Ia SN rate observed by Cappellaro et al. (1997), whereas the green one stands for Type II SN rates observed by Li et al. (2011).
Current usage metrics show cumulative count of Article Views (full-text article views including HTML views, PDF and ePub downloads, according to the available data) and Abstracts Views on Vision4Press platform.
Data correspond to usage on the plateform after 2015. The current usage metrics is available 48-96 hours after online publication and is updated daily on week days.
Initial download of the metrics may take a while.