Fig. 4.
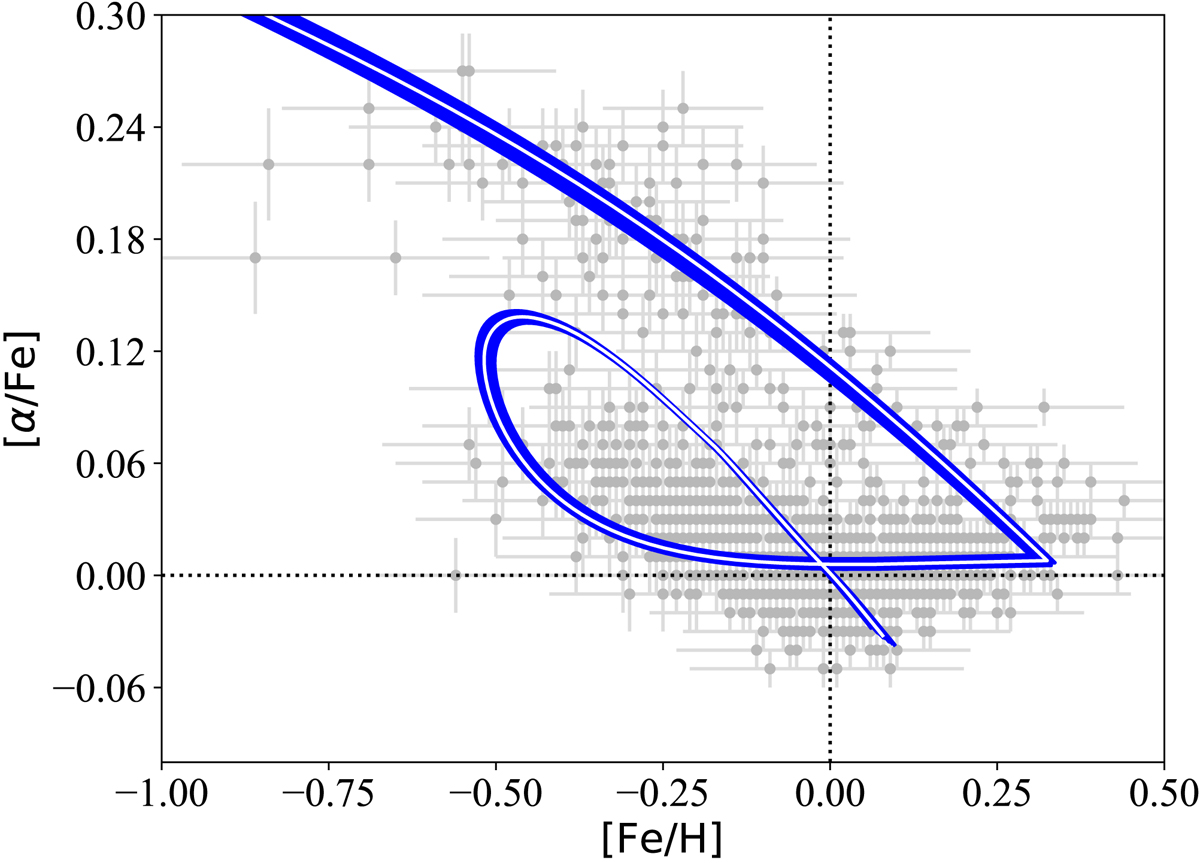
Observed [α/Fe] vs. [Fe/H] abundance ratios presented by Silva Aguirre et al. (2018, grey points), compared with model results constrained only by abundance ratio data with three free parameters, composed by the set Θ = {τ1, τ2, tmax} (see Sect. 4). The blue lines correspond to 100 walkers at the last step, and the thin white line indicates the best-fit model.
Current usage metrics show cumulative count of Article Views (full-text article views including HTML views, PDF and ePub downloads, according to the available data) and Abstracts Views on Vision4Press platform.
Data correspond to usage on the plateform after 2015. The current usage metrics is available 48-96 hours after online publication and is updated daily on week days.
Initial download of the metrics may take a while.