Fig. 13.
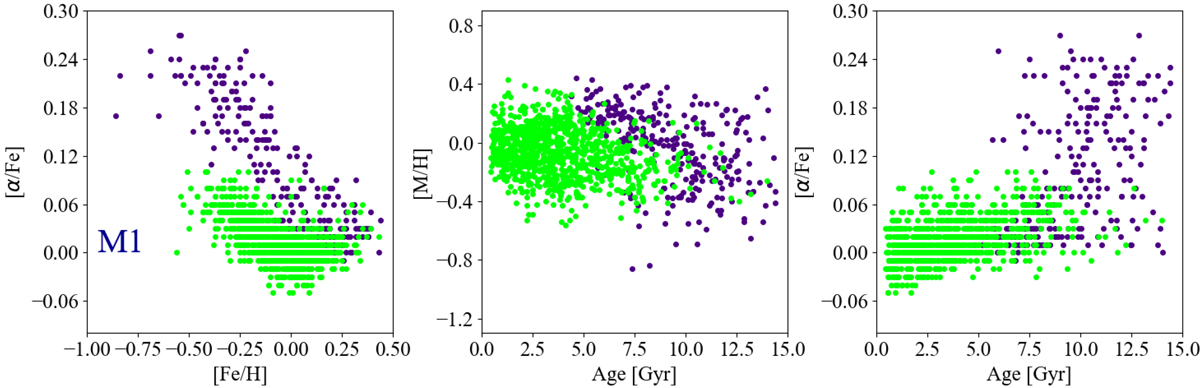
Disc dissection of the APOKASC sample of Silva Aguirre et al. (2018) in high-α (violet points) and low-α (green points) sequence stars based on the chemical evolution model M1. Left panel: abundance ratios [α/Fe] vs. [Fe/H] for the APOKASC sample. The age metallicity relation and the temporal evolution of the [α/Fe] are shown in the middle and right panels, respectively.
Current usage metrics show cumulative count of Article Views (full-text article views including HTML views, PDF and ePub downloads, according to the available data) and Abstracts Views on Vision4Press platform.
Data correspond to usage on the plateform after 2015. The current usage metrics is available 48-96 hours after online publication and is updated daily on week days.
Initial download of the metrics may take a while.