Fig. 1.
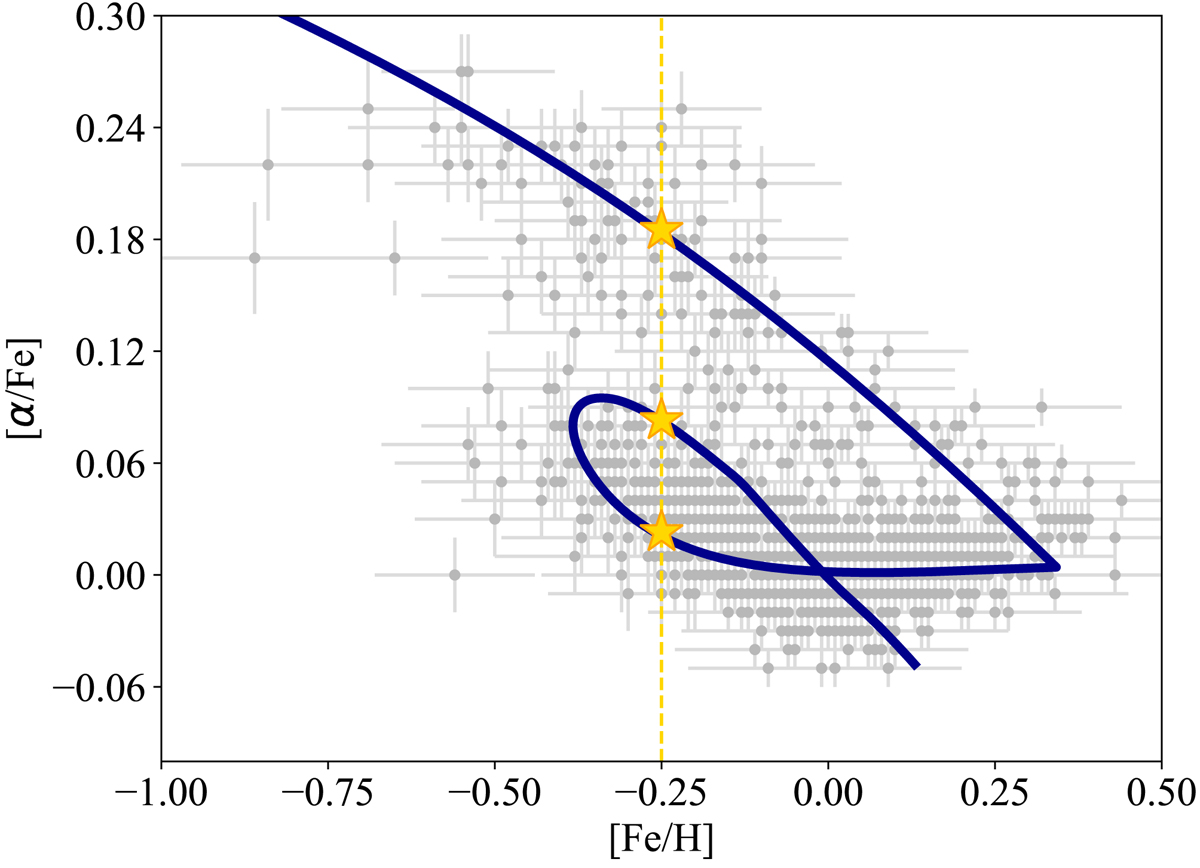
Observed [α/Fe] vs. [Fe/H] abundance ratios of the APOKASC sample (grey points) presented by Silva Aguirre et al. (2018) compared with the two-infall chemical evolution model characterised by τ1 = 0.1 Gyr, τ2 = 8 Gyr, σ2 = 64 M⊙ pc−2, σ2/σ1 = 4, and ν = 1.3 Gyr−1. The three yellow points clearly show that the predicted chemical evolution curve is multi-valued in this plane (they exhibit three different [α/Fe] values for the same [Fe/H] abundance ratio).
Current usage metrics show cumulative count of Article Views (full-text article views including HTML views, PDF and ePub downloads, according to the available data) and Abstracts Views on Vision4Press platform.
Data correspond to usage on the plateform after 2015. The current usage metrics is available 48-96 hours after online publication and is updated daily on week days.
Initial download of the metrics may take a while.