Fig. 8.
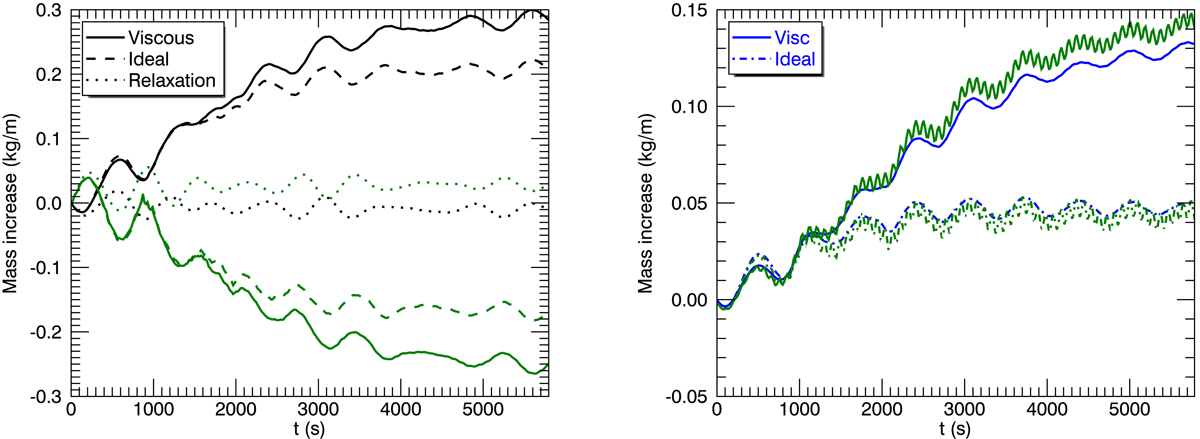
Left: mass increase (kg m−1) for the three simulations (viscous, solid lines; ideal, dashed lines; non-driven, dotted lines). The black lines correspond to the integrated mass in the coronal part of the domain whereas the green lines represent the mass in the non-coronal part. Right: mass increase (kg m−1; blue lines) but now only integrated over the coronal part of the shell region (viscous, solid lines; ideal, dotted-dashed lines). The green lines represent the time integrated, averaged mass flux (where the averaging is done over the 4 boundaries of the shells).
Current usage metrics show cumulative count of Article Views (full-text article views including HTML views, PDF and ePub downloads, according to the available data) and Abstracts Views on Vision4Press platform.
Data correspond to usage on the plateform after 2015. The current usage metrics is available 48-96 hours after online publication and is updated daily on week days.
Initial download of the metrics may take a while.