Free Access
Fig. A.2.
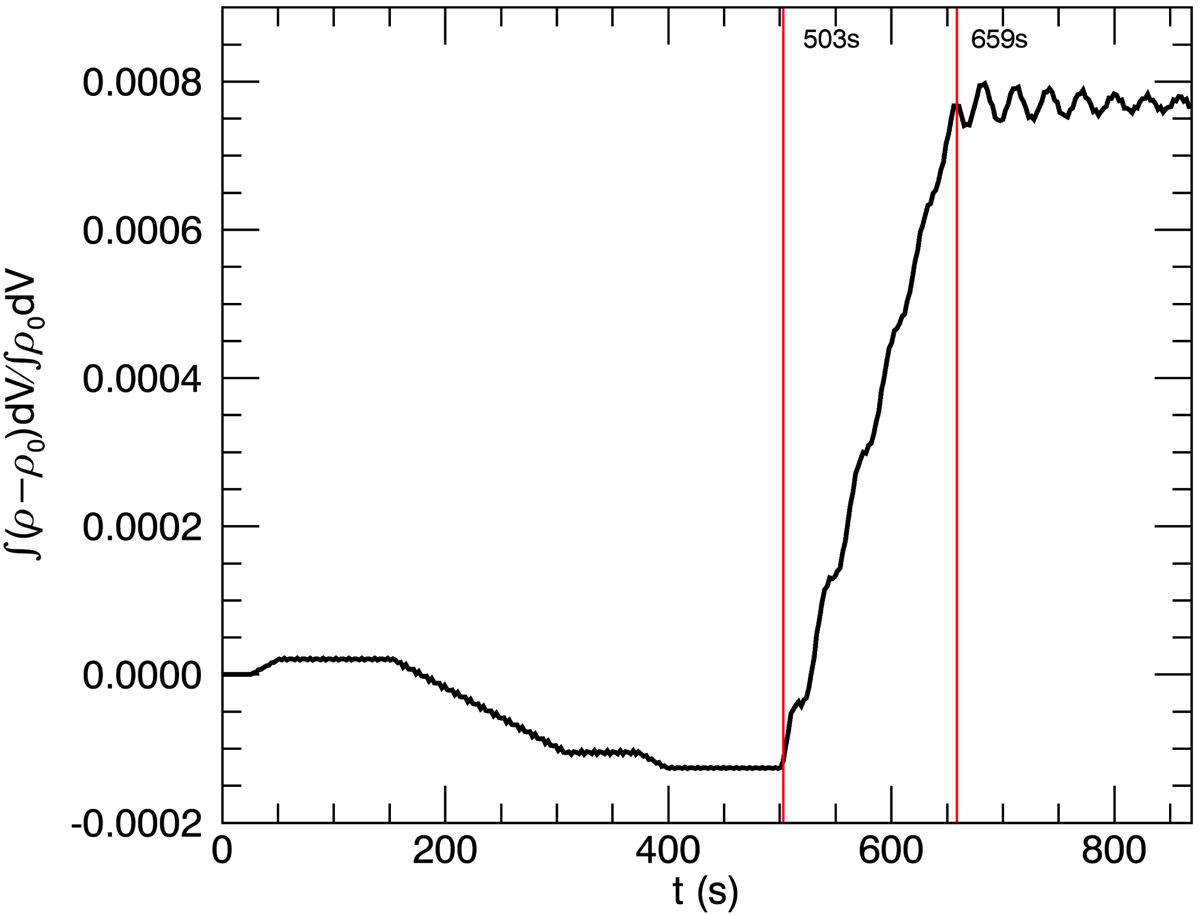
Relative mass increase ∫(ρ − ρ0)dV/∫ρ0dV with time in the region y = 230−260 Mm. The red vertical lines mark the times when the slow wave, that is generated at t = 347 s at the location of the driver, arrives and leaves this region.
Current usage metrics show cumulative count of Article Views (full-text article views including HTML views, PDF and ePub downloads, according to the available data) and Abstracts Views on Vision4Press platform.
Data correspond to usage on the plateform after 2015. The current usage metrics is available 48-96 hours after online publication and is updated daily on week days.
Initial download of the metrics may take a while.