Fig. 1
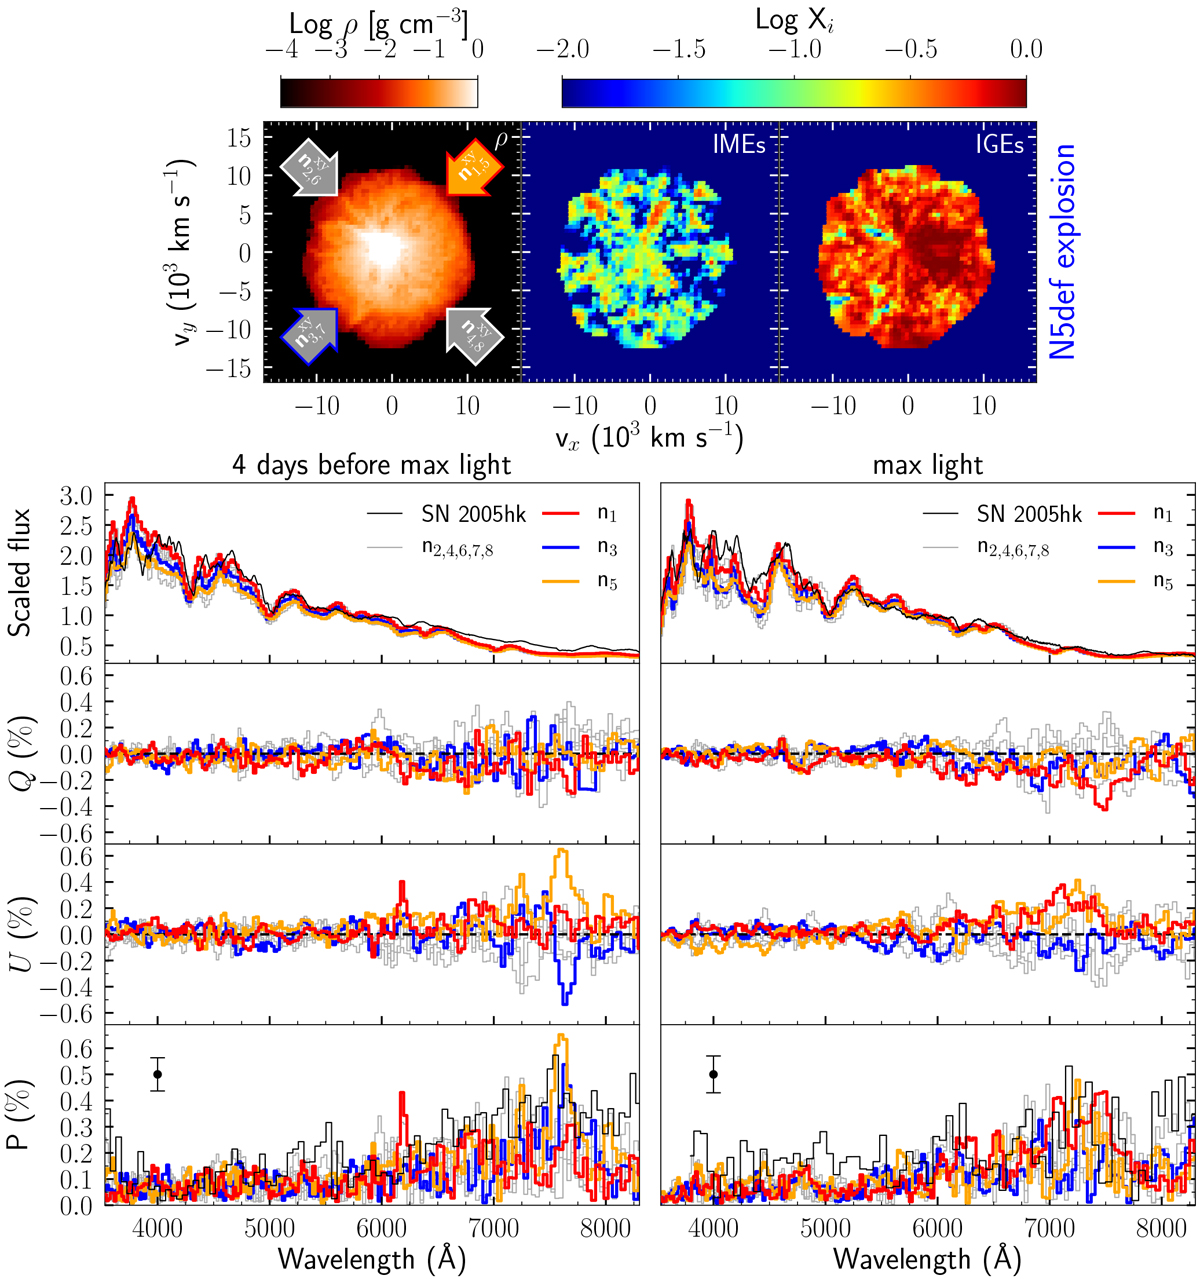
Top panels: ejecta composition for the N5def3D model. Density ρ (left) and mass fraction Xi of IMEs (middle) and IGEs (right) are shown in the x–y plane. The x–y projected direction of the 8 viewing angles is shown in the density panel. Bottom panels: flux, Q, U and polarisation spectra (from top to bottom) of the N5def3D models are shown 4 days before (left) and at maximum light (right) for the 8 different orientations (n1 −n8) highlighted in the top left panel. Flux and polarisation P of SN 2005hk is shown in black for comparison, with polarimetric data from Maund et al. (2010, bottom right panel) re-binned of a factor of two to have a similar wavelength resolution (Δλ ~ 50 Å) and polarisation uncertainties (σP ~ 0.06 per cent, error bars inbottom panels) as those from Chornock et al. (2006, bottom left panel). Both observed and modelled fluxes are normalised at 6000 Å for presentation purposes.
Current usage metrics show cumulative count of Article Views (full-text article views including HTML views, PDF and ePub downloads, according to the available data) and Abstracts Views on Vision4Press platform.
Data correspond to usage on the plateform after 2015. The current usage metrics is available 48-96 hours after online publication and is updated daily on week days.
Initial download of the metrics may take a while.