Fig. B.2.
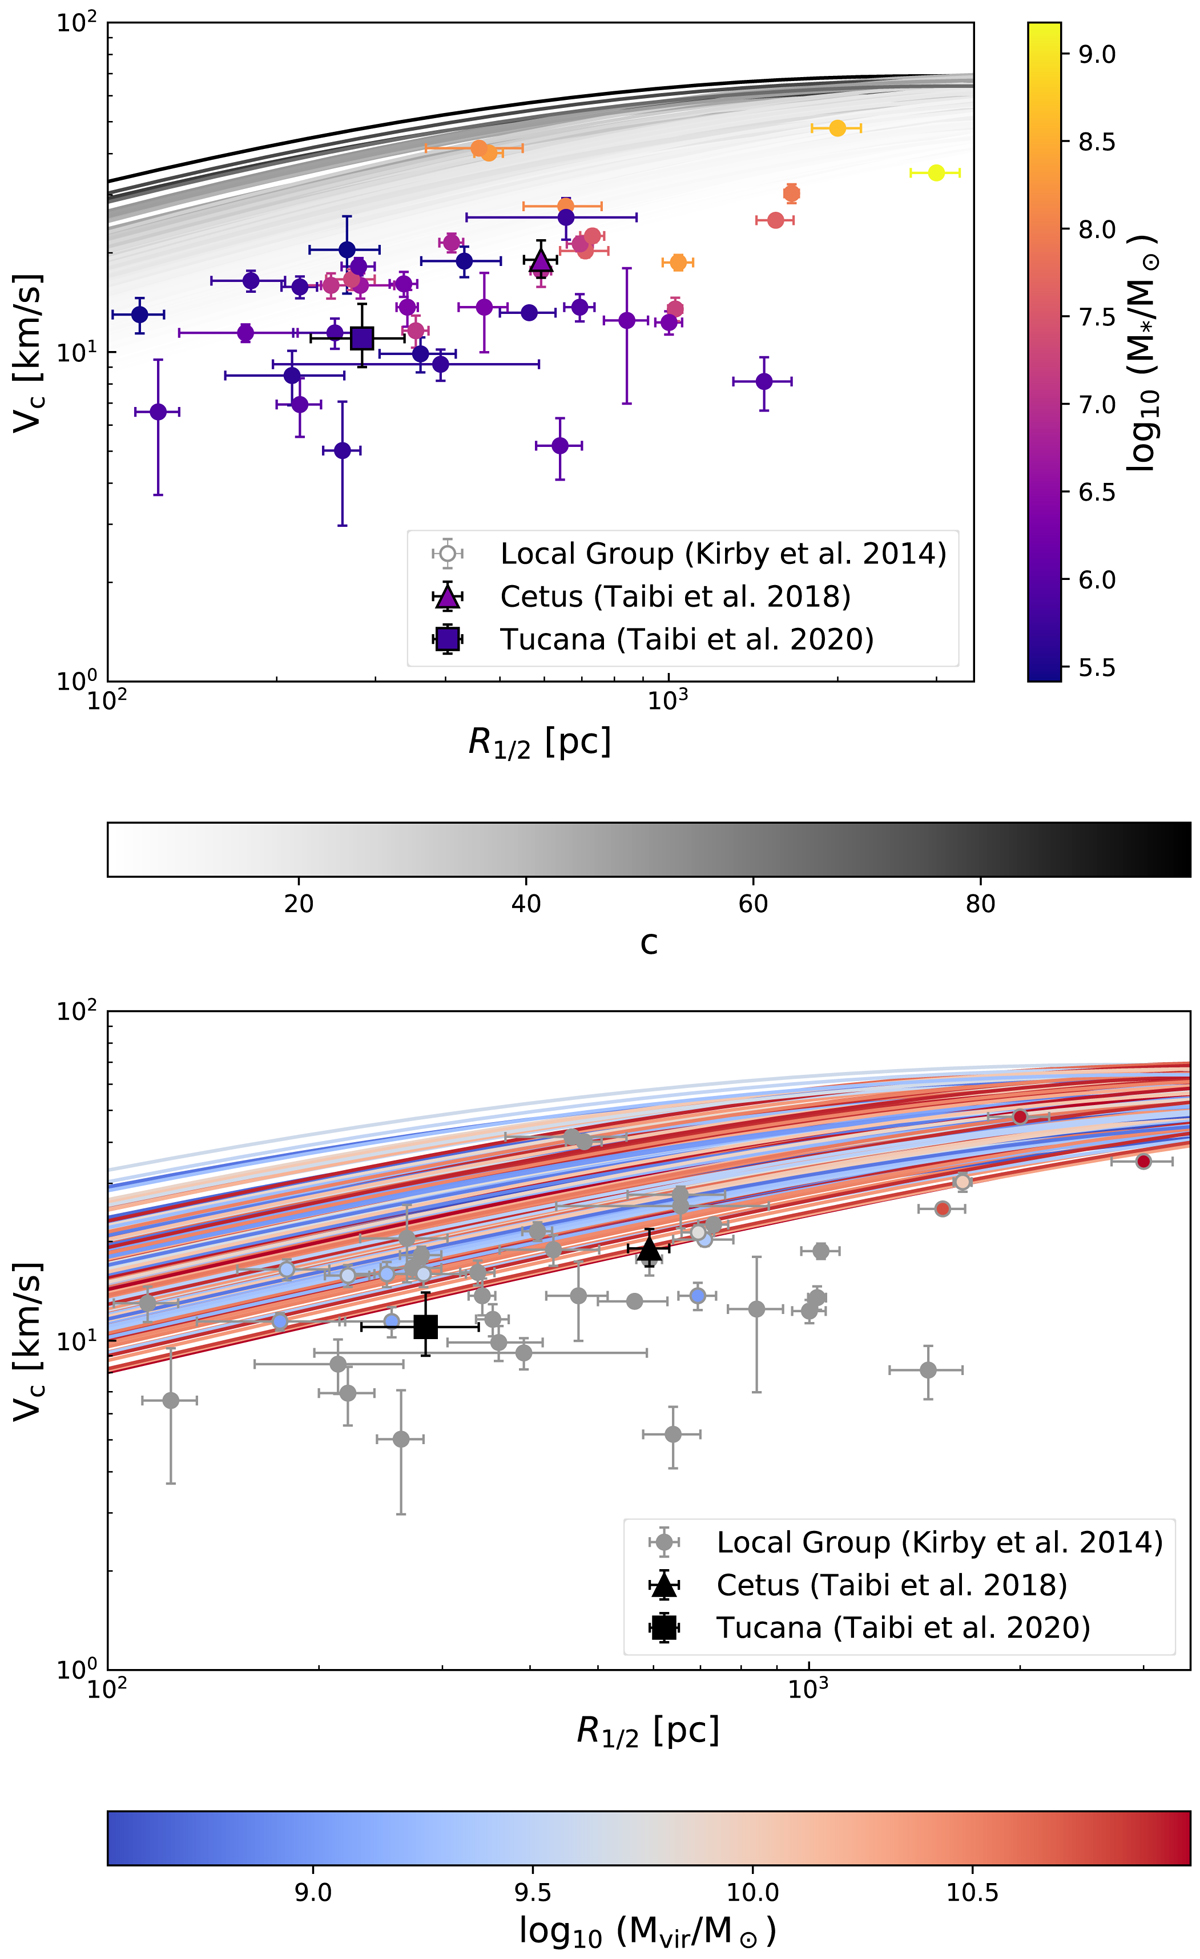
Same as Fig. 5, but with halo circular velocity profiles color-coded by concentration (top) and virial mass (bottom). Cetus and Tucana are shown as a triangle and a square, respectively. Top panel: the Local Group dwarf galaxies are color-coded according to their stellar mass; a probable correlation is visible between the circular velocity and the stellar mass. Bottom panel: the color-coded dots that follow the same color schema as the halo virial mass profiles are Local Group dwarf galaxies, for which virial masses were obtained from dynamical modeling (Read & Erkal 2019; Leaman et al. 2012).
Current usage metrics show cumulative count of Article Views (full-text article views including HTML views, PDF and ePub downloads, according to the available data) and Abstracts Views on Vision4Press platform.
Data correspond to usage on the plateform after 2015. The current usage metrics is available 48-96 hours after online publication and is updated daily on week days.
Initial download of the metrics may take a while.