Fig. A.1.
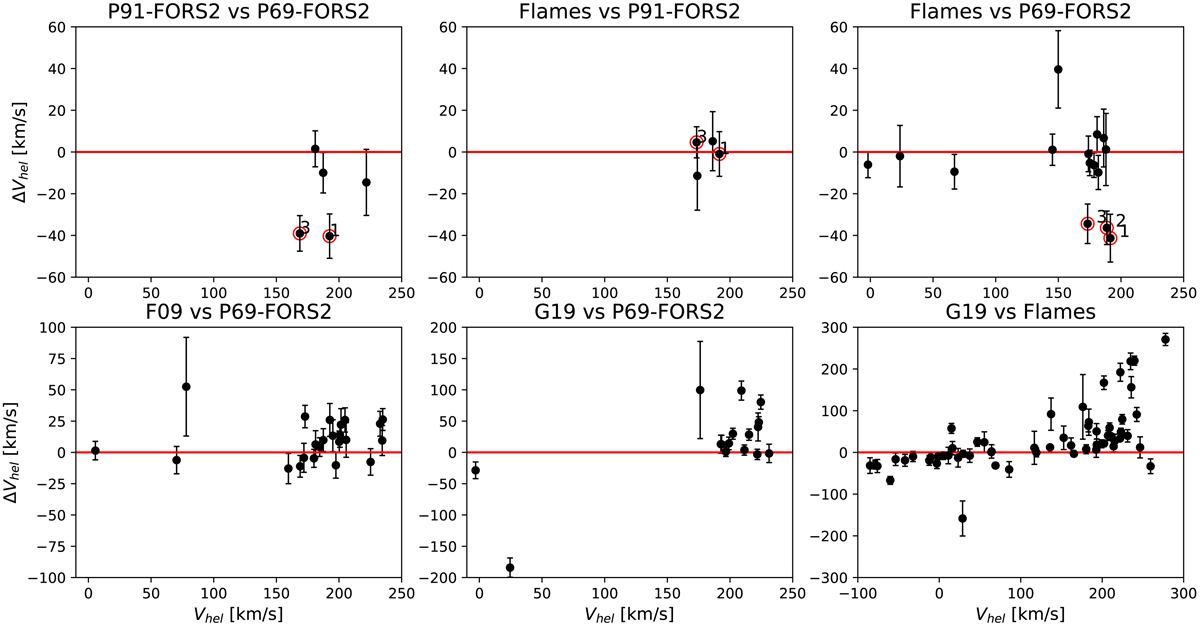
Velocity comparison for common targets between datasets – vhel vs. Δvhel. Top: between the datasets from our internal reduction – left: FORS2 datasets; center: flames vs. P91-FORS2; right: flames vs. P69-FORS2. Red circles indicate the problematic targets highlighted in the main text. Bottom: between our datasets and those from the literature – left: F09 vs. P69-FORS2; central: G19 vs. P69-FORS2; right: G19 vs. flames.
Current usage metrics show cumulative count of Article Views (full-text article views including HTML views, PDF and ePub downloads, according to the available data) and Abstracts Views on Vision4Press platform.
Data correspond to usage on the plateform after 2015. The current usage metrics is available 48-96 hours after online publication and is updated daily on week days.
Initial download of the metrics may take a while.