Fig. 6.
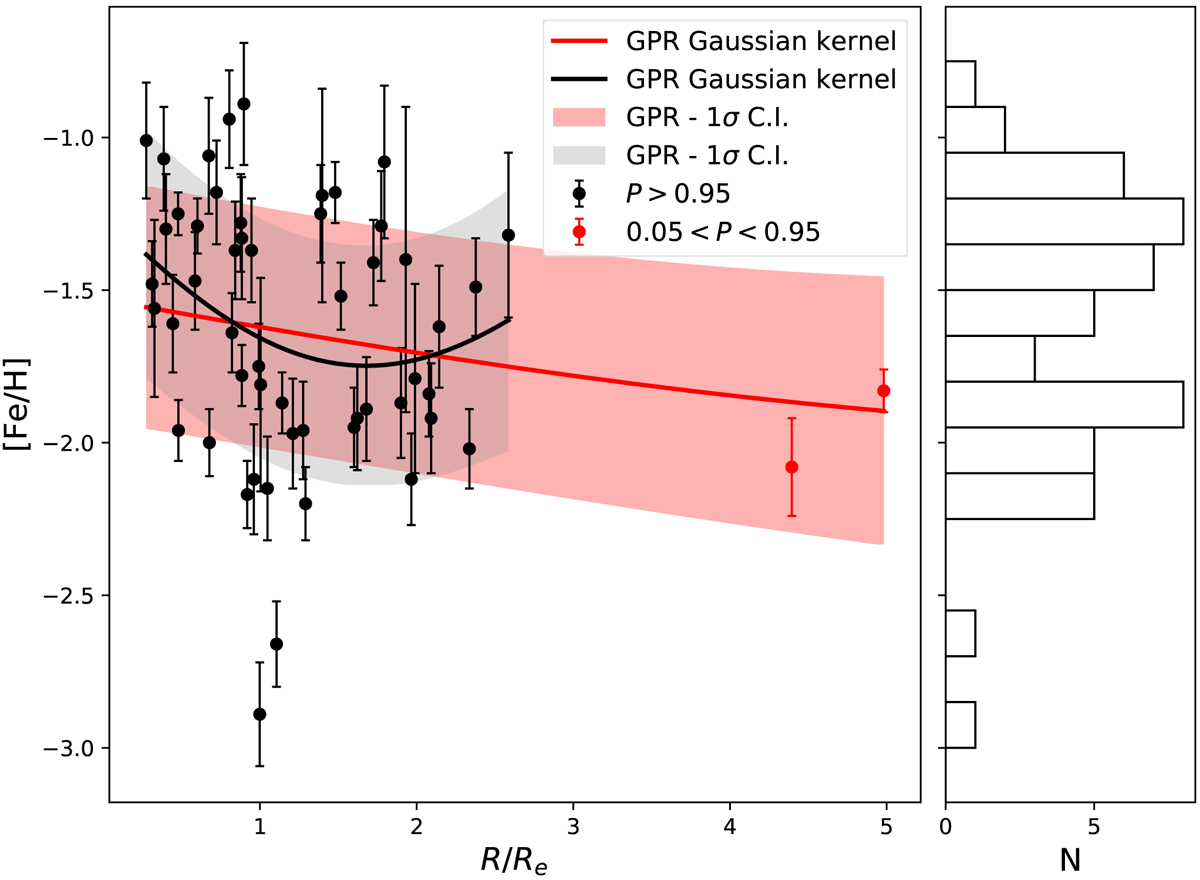
[Fe/H] as a function of the elliptical radius scaled with Re for Tucana’s probable member stars from the FORS2 combined dataset. Black dots represent the targets with membership probabilities P > 0.95, while the red dots show those with 0.05 < P < 0.95. The black solid line represents the result of a Gaussian process regression analysis using a Gaussian kernel and taking into account an intrinsic scatter; the gray band indicates the corresponding 1-σ confidence interval. The solid red line and the red band indicate the same, but using all targets with P > 0.05. The histogram on the right side represents the metallicity distribution of the stars with P > 0.95.
Current usage metrics show cumulative count of Article Views (full-text article views including HTML views, PDF and ePub downloads, according to the available data) and Abstracts Views on Vision4Press platform.
Data correspond to usage on the plateform after 2015. The current usage metrics is available 48-96 hours after online publication and is updated daily on week days.
Initial download of the metrics may take a while.