Fig. 3.
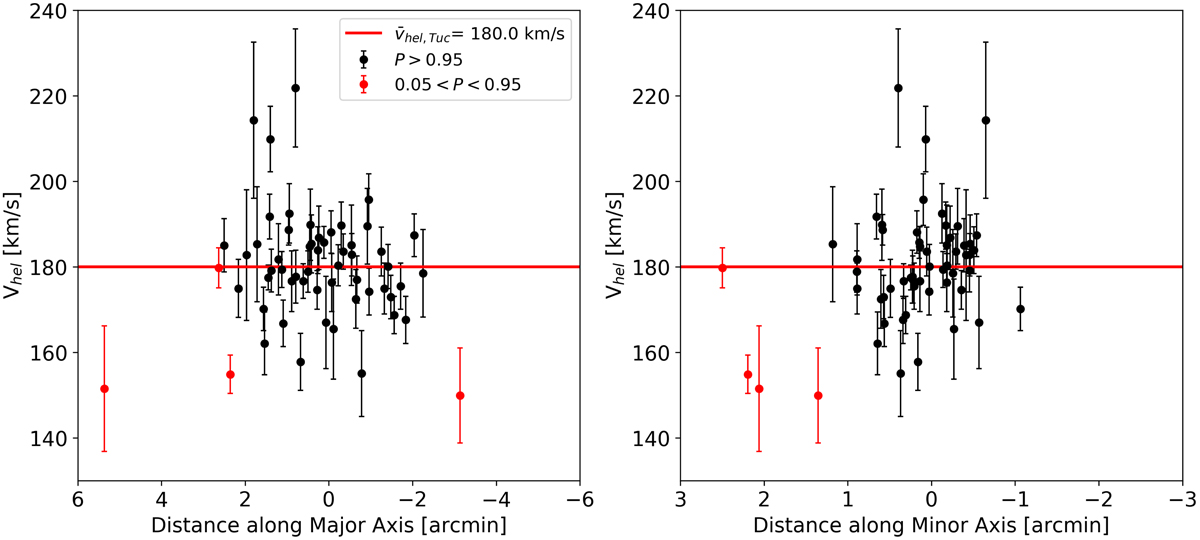
Line-of-sight velocity distributions of the stars from the combined FORS2 + FLAMES dataset, having membership probabilities P > 0.95 (in black) and 0.05 < P < 0.95 (in red). The red solid line indicates the systemic velocity obtained from the kinematic analysis. Left panel: distribution along the optical major axis; right panel: along the minor axis.
Current usage metrics show cumulative count of Article Views (full-text article views including HTML views, PDF and ePub downloads, according to the available data) and Abstracts Views on Vision4Press platform.
Data correspond to usage on the plateform after 2015. The current usage metrics is available 48-96 hours after online publication and is updated daily on week days.
Initial download of the metrics may take a while.