Fig. 2.
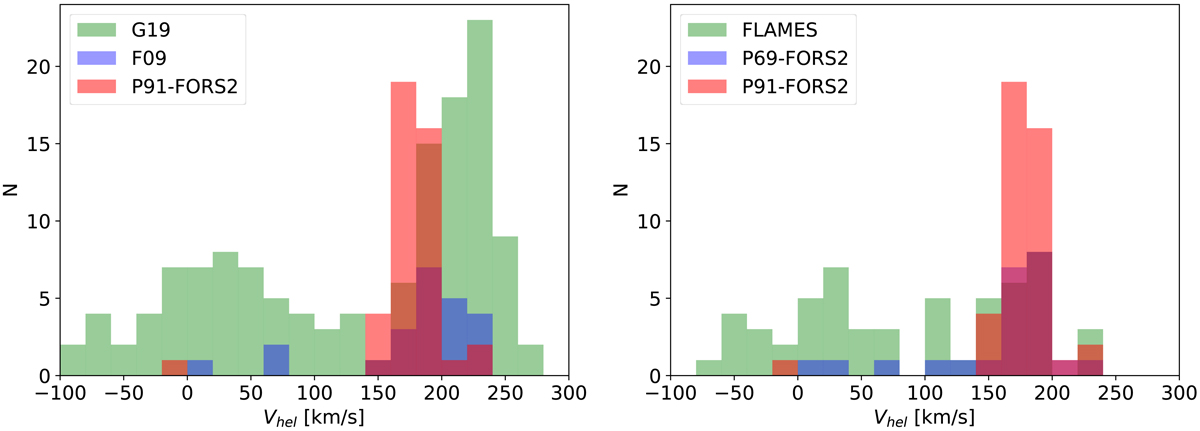
Histogram of l.o.s. velocity measurements from the analyzed datasets. Left: comparing the velocities from the P91-FORS2 dataset with those from literature, i.e. Fraternali et al. (2009) and Gregory et al. (2019). Right: same comparison using instead the velocity measurements from our reduction of the P69-FORS2 and FLAMES datasets. Note that, in the left panel, the peaks of the histograms fall at different velocities, while in the right panel, where the datasets shown were analyzed homogeneously, these differences are absent.
Current usage metrics show cumulative count of Article Views (full-text article views including HTML views, PDF and ePub downloads, according to the available data) and Abstracts Views on Vision4Press platform.
Data correspond to usage on the plateform after 2015. The current usage metrics is available 48-96 hours after online publication and is updated daily on week days.
Initial download of the metrics may take a while.