Fig. 1.
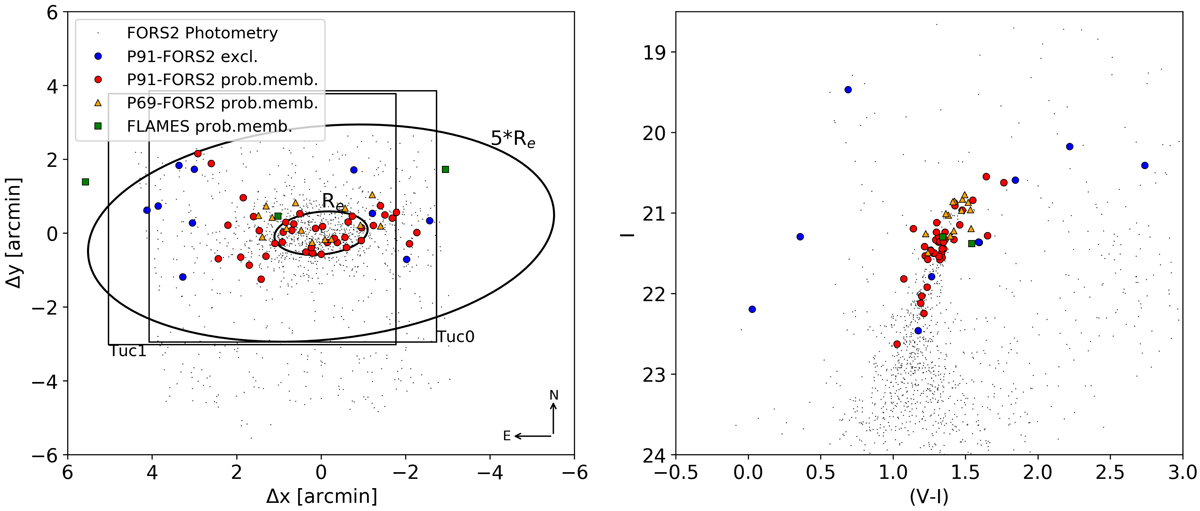
Spatial distribution (left) and color-magnitude diagram (right) of stars along the line of sight to the Tucana dSph. Black points represent the objects classified as stars in the FORS2 photometric data (see main text); red and blue dots indicate the P91-FORS2 MXU targets classified as probable members (i.e., with P > 0.05) and non-members, respectively. Yellow triangles and green squares represent the probable member stars from the P69-FORS2 and FLAMES datasets, respectively, which were added to the P91-FORS2 and analyzed through the text. The two observed FORS2 pointings are represented as large squares, while the ellipses denote the galaxy half-light radius and the spatial extension of the dataset (i.e., up to 5 × Re ∼ Rtidal). We note that the photometric data are not corrected for reddening.
Current usage metrics show cumulative count of Article Views (full-text article views including HTML views, PDF and ePub downloads, according to the available data) and Abstracts Views on Vision4Press platform.
Data correspond to usage on the plateform after 2015. The current usage metrics is available 48-96 hours after online publication and is updated daily on week days.
Initial download of the metrics may take a while.