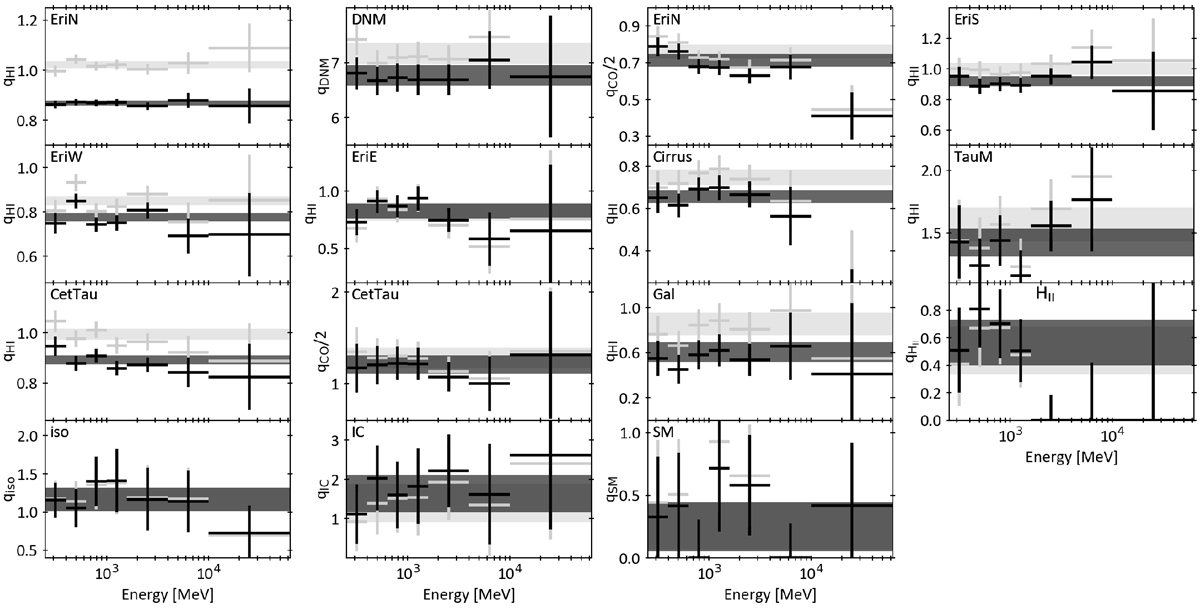
Fig. D.1

Spectral evolution of the γ-ray emissivities relative to the local ISM qLIS. The light grey crosses correspond to the optically thin spectrum and the black crosses to the 100 K case, favoured by the fit. The corresponding bands give the average emissivity and its errors. The qCO coefficients are expressed in 1020 cm−2 K−1 km−1 s, qH II in 1020 cm−2, qDNM in 1025 cm−2. The other q coefficients are simple normalisation factors.
Current usage metrics show cumulative count of Article Views (full-text article views including HTML views, PDF and ePub downloads, according to the available data) and Abstracts Views on Vision4Press platform.
Data correspond to usage on the plateform after 2015. The current usage metrics is available 48-96 hours after online publication and is updated daily on week days.
Initial download of the metrics may take a while.


