Fig. 3.
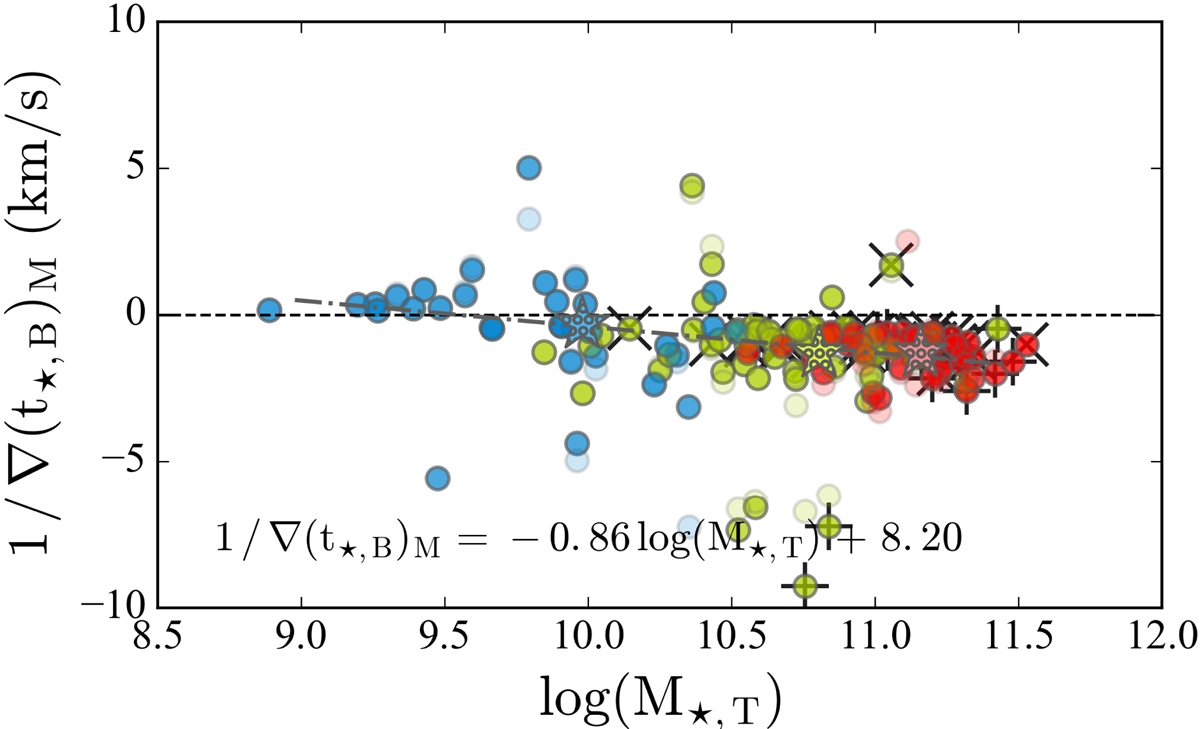
Logarithm of total stellar mass ℳ⋆, T vs. age gradient (determinations from weighted linear fits) translated into an average inside-out SF quenching velocity (vq; negative values) or outside-in SF shrinking velocity (positive values) in the bulge. Dashed-dotted lines show linear fits. The meaning of symbols is identical to that in Fig. 2.
Current usage metrics show cumulative count of Article Views (full-text article views including HTML views, PDF and ePub downloads, according to the available data) and Abstracts Views on Vision4Press platform.
Data correspond to usage on the plateform after 2015. The current usage metrics is available 48-96 hours after online publication and is updated daily on week days.
Initial download of the metrics may take a while.