Fig. 1.
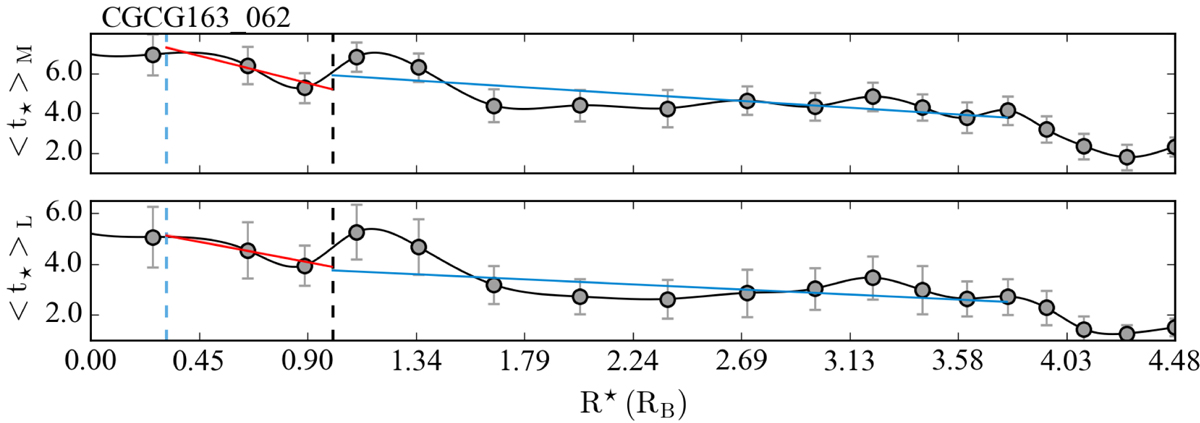
Illustration of the derivation of ∇(t⋆, B)ℳ and ∇(t⋆, B)ℒ in the bulge through linear fits (red lines) between RPSF and RB (blue and black vertical dashed lines, respectively) to spline-interpolated stellar age determinations (gray curves) within individual isan (markers). Error bars show the standard deviation about the mean of single-spaxel determinations within each isan.
Current usage metrics show cumulative count of Article Views (full-text article views including HTML views, PDF and ePub downloads, according to the available data) and Abstracts Views on Vision4Press platform.
Data correspond to usage on the plateform after 2015. The current usage metrics is available 48-96 hours after online publication and is updated daily on week days.
Initial download of the metrics may take a while.