Fig. 8.
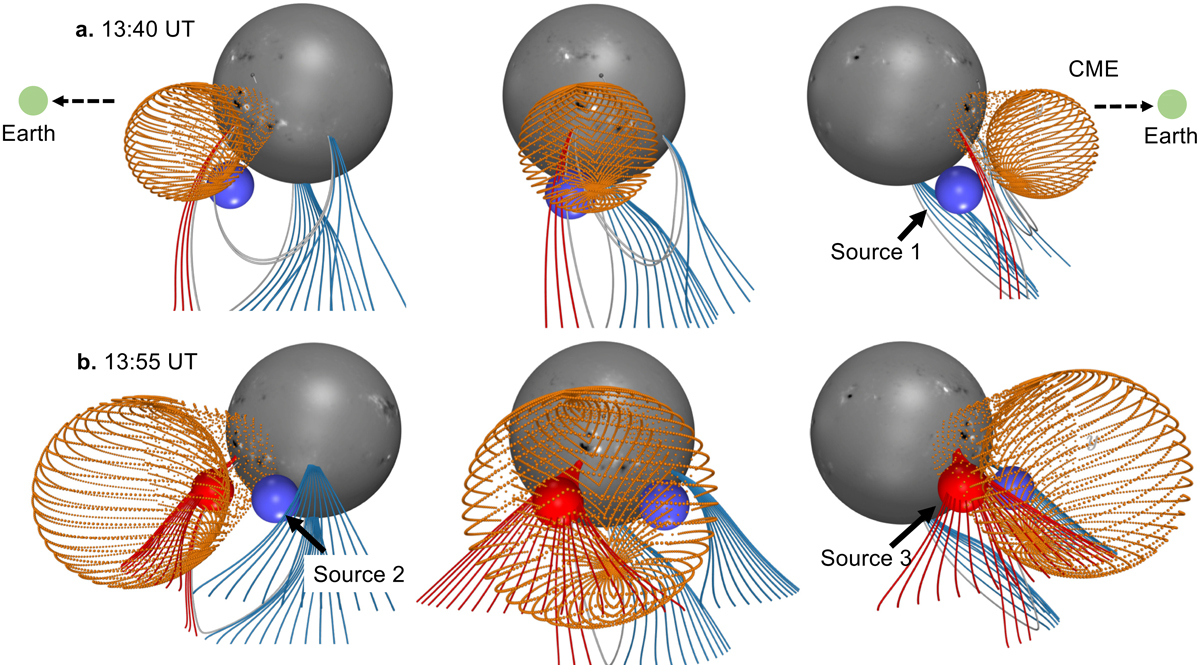
3D model of the CME bubble and electron acceleration locations. Each panel in this figure shows a different perspective similar to that of STEREO-A (left), plane-of-sky such as the SDO plane (middle), and STEREO-B (right). The magnetic field polarity (white for positive and black for negative) from photospheric magnetograms is overlaid on top of the surface of the solar sphere. Panel a: reconstruction of the CME eruption in the solar corona at 13:40 UT during the occurrence of Source 1. The orange mesh represents the CME bubble and the extrapolated magnetic field lines around the CME are plotted as red (negative polarity) and blue (positive polarity) lines for the open field and grey lines for the closed field. Source 1 (blue sphere) is located outside the CME. Panel b: reconstruction of the CME eruption in the solar corona at 13:55 UT during the occurrence of Sources 2 and 3, which are located on either side of the CME. These radio sources are also located in open field regions surrounding the CME.
Current usage metrics show cumulative count of Article Views (full-text article views including HTML views, PDF and ePub downloads, according to the available data) and Abstracts Views on Vision4Press platform.
Data correspond to usage on the plateform after 2015. The current usage metrics is available 48-96 hours after online publication and is updated daily on week days.
Initial download of the metrics may take a while.