Fig. 7.
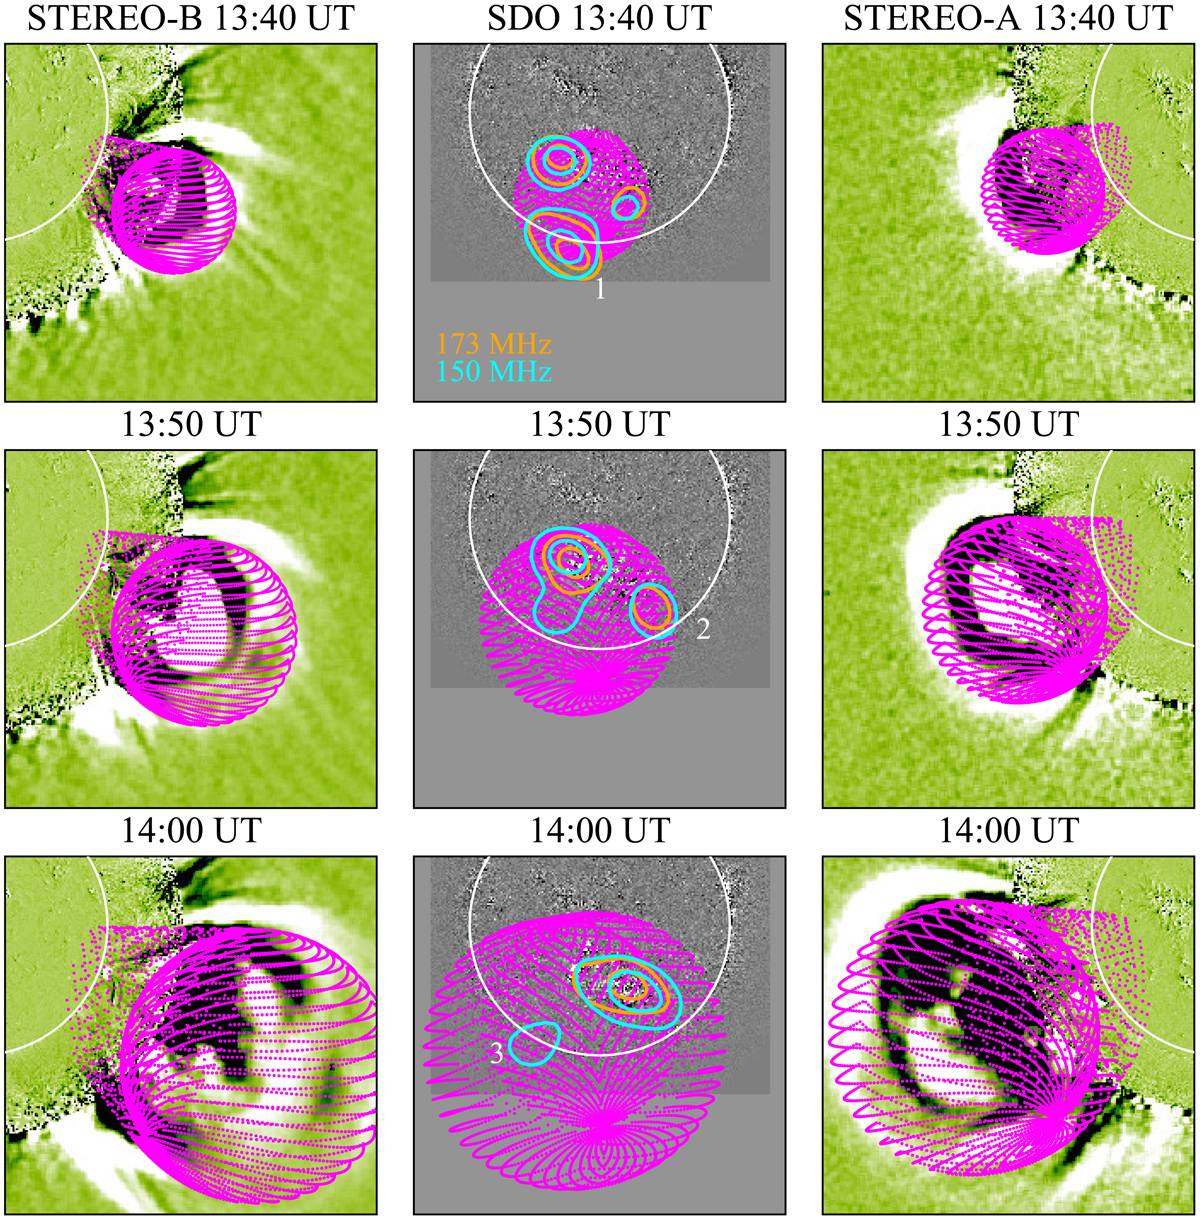
3D fitting of the CME bubble from three perspectives. The perspectives are images from STEREO-B, SDO, and STEREO-A from left to right, at three different times from top to bottom (13:40, 13:50, and 14:00 UT). The perspectives show the expansion of the CME fitted with the GCS model applied on the CME bubble (magenta dots). The radio contours at two frequencies (150 and 173 MHz) are overlaid in the middle panels on the SDO images.
Current usage metrics show cumulative count of Article Views (full-text article views including HTML views, PDF and ePub downloads, according to the available data) and Abstracts Views on Vision4Press platform.
Data correspond to usage on the plateform after 2015. The current usage metrics is available 48-96 hours after online publication and is updated daily on week days.
Initial download of the metrics may take a while.