Fig. 4.
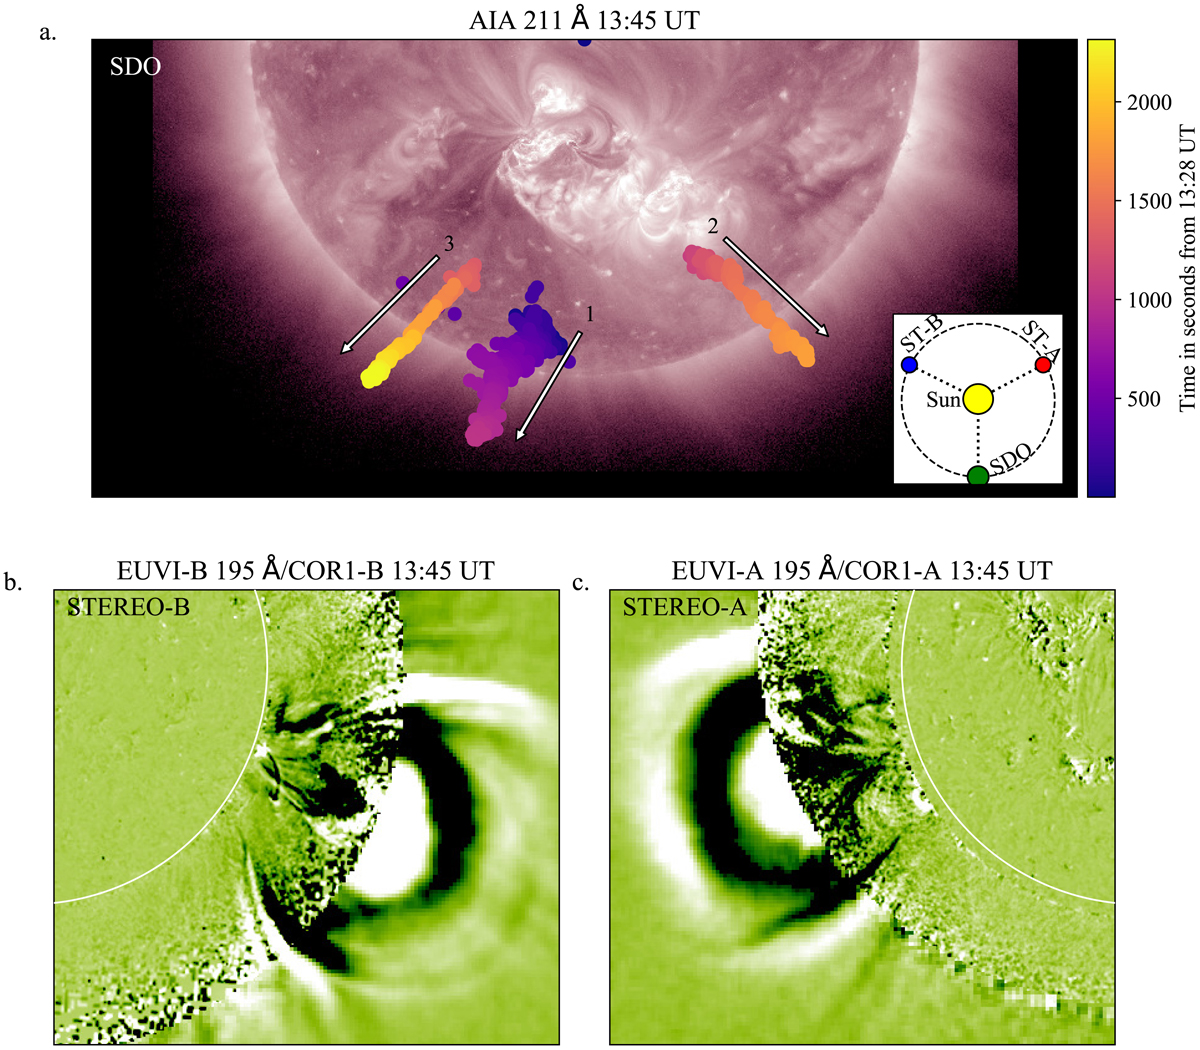
Centroids of moving radio sources through time and associated solar activity visible from three perspectives. Panel a: centroids of the three moving sources identified in Fig. 1, overlaid on an SDO/AIA 211 Å image of the Sun at 13:45 UT. The centroids are colour-coded through time from 13:28 until 14:06 UT. In the AIA image, the source active region appears bright as a result of the sudden energy release of the M-class flare, however the accompanying CME is not visible. Panel b: solar activity as viewed from the STEREO-B perspective that captures a side view of the flare and associated CME from the eastern side with respect to the SDO field of view at 13:45 UT. Panel c: solar activity as viewed from the STEREO-A perspective that captures a side view of the flare and associated CME from the western side with respect to the SDO field of view at 13:45 UT. The EUV images at 195 Å from EUVI are combined with coronograph images from the COR1 cameras onboard both STEREO-A and -B. The locations of SDO, STEREO-A, and STEREO-B in the ecliptic plane relative to the Sun can be seen in the insert in panel a.
Current usage metrics show cumulative count of Article Views (full-text article views including HTML views, PDF and ePub downloads, according to the available data) and Abstracts Views on Vision4Press platform.
Data correspond to usage on the plateform after 2015. The current usage metrics is available 48-96 hours after online publication and is updated daily on week days.
Initial download of the metrics may take a while.